
User`s manual


Smart Features
6-20 BASLER A620
f
DRAFT
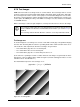
Test Image Two
As shown in Figure 6-4, test image two consists of rows with several gray scale gradients ranging
from 0 to 255. Assuming that the camera is operating at full 1280 x 1024 resolution and is set for
a monochrome, 8 bit output mode, when the test images are generated:
• rows 0, 1, and 2 start with a gray value of 0 for the first pixel,
• rows 3, 4, 5, and 6 start with a gray value of 1 for the first pixel,
• rows 7, 8, 9, and 10 start with a gray value of 2 on the first pixel, and so on.
(If the camera is operating at a lower resolution when the test images are generated, the basic
appearance of the test pattern will be similar to Figure 6-4, but the staring pixel values on each
row will not be as described above.)
The mathematical expression for test image two is:
Figure 6-4: Test Image Two
Test Image Three
Test image three is similar to test image one but it is not stationary. The image moves by 1 pixel
from right to left whenever a one-shot or a continuous-shot command signal is sent to the camera.
grayvalue
[ x + y + 1 ]
4
----------------------------- M O D 2 5 6 , r o un d o f f al l v a l u e s=