
System information

Traffic Green Blinks when the Barracuda Message
Archiver processes traffic.
Data I/O Green Blinks during data transfer.
Power Green Displays a solid green light when the system
is powered on.
Reports
This article refers to the Barracuda Message Archiver release 3.1 and higher, except where noted.
In this article:
Email Activity Report
Top Storage Users Report
Policy Violations Report
Global Searches Report
Usage Report (Available only in Release 3.2 and Higher)
Generate Reports
Show Report
Email Report
Daily Report Email Options
Report Properties
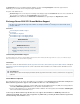
The built-in reports on the Barracuda Message Archiver provide statistics on various operational, legal, and storage aspects. Default reports
include message archive growth, policy violations, archive traffic, and cost analysis and projected archive storage growth.
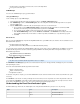
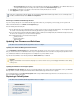
On the page you can generate the following reports:BASIC > Reports
Email Activity Report - View Barracuda Message Archiver email activity by user
Top Storage Users Report - View Barracuda Message Archiver storage usage by user
Policy Violations Report - View Barracuda Message Archiver email policy violations by user
Global Searches Report - View the top Barracuda Message Archiver global searches by user
Usage Report (available in release 3.2 and higher) - Generate an overview of Barracuda Message Archiver cost analysis and projected
archive storage growth
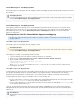
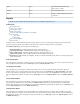
Email Activity Report
This report displays the total number of emails by user for the specified date range. The report displays a list of all users and their email count as
well as a graphical representation based on the selection in the section.Chart Type Report Properties
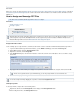
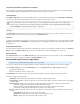
Top Storage Users Report
This report displays a list of top storage users and the total storage each user has used on the Barracuda Message Archiver. Specify the
maximum number of users you wish to display in the report by entering a value in the field in the section. WhenTop Count Report Properties
the report is generated, the report displays a list of the top storage users based on the value in the field, the total storage used byTop Count
each, and a graphical representation of usage based on your selection in the section on the paChart Type Report Properties BASIC > Reports
ge.
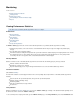
Policy Violations Report
This report displays a list of policies and the number of times that a policy was violated within the specified date range. This report includes
custom policies, and all built-in policies when enabled on the page. When the report is generated, the report displays thePOLICY > Alerts
number of times the policies were violated within the selected date range. Additionally, a graph displays the data based on your selecChart Type
tion in the section on the page.Report Properties BASIC > Reports
Global Searches Report
This report displays a list of all global searches performed within the specified date range by users with the or role. This reportadmin auditor
includes the global search criteria, the user who performed the search, and the number of times the global search was performed. Additionally, a
graph displays the number of times each global search was performed based on your selection in the section onChart Type Report Properties
the page.BASIC > Reports