
System information


Monitoring
In this Section
Viewing Performance Statistics
Setting Up Alerts
Viewing System Tasks
Understanding the Front Panel Indicator Lights
Reports
Viewing Performance Statistics
This article refers to the Barracuda Message Archiver release 3.1 or higher.
In this article:
Message Statistics
Performance Statistics
Policy Statistics
Storage Statistics
Subscription Status
Cluster Status
Hourly and Daily Statistics
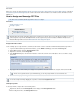
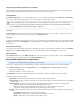
The page provides an overview of the health and performance of your Barracuda Message Archiver, including:BASIC > Status
Traffic and policy statistics, such as the amount of overall email traffic and how many messages have triggered a particular policy
category.
The subscription status of Energize Updates.
Performance statistics including CPU temperature and system load. Performance statistics displayed in red signify that the value exceeds
the normal threshold. These values fluctuate based on the amount of traffic that is being handled. However, if any setting remains
consistently in the red for a long period of time, contact Barracuda Networks Technical Support.
Message Statistics
Statistics for all items stored on the Barracuda Message Archiver, broken down into the following groups by hour, day, and total:
Inbound, outbound, and internal emails
Appointments, contacts, notes, and tasks
Any other data belonging to users in your managed domains that were also sent to the Barracuda Message Archiver
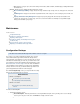
Performance Statistics
(Not available to )auditors
The Performance Statistics section displays information on the current operating status and performance of the Barracuda Message Archiver
including:
System load, CPU fan speed and temperature, and system fan speed and temperature
Firmware storage and mail/log storage
Redundancy (RAID)
Index queue length and last message archived
Cloud Control
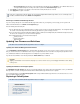
Policy Statistics
Statistics for all built-in and the chosen on the policy alerts policies POLICY > Alerts page for listing on the dashboard. Details regarding each of
the Policies listed can be found on the POLICY > Alerts page.
To choose which policies to display in this table, go to the page (or click ), and select the checkPOLICY > Alerts Policy Definitions Dashboard