
Manual

Q60 Series Adjustable-Field Sensors
page 4
Banner Engineering Corp. • Minneapolis MN, U.S.A.
www.bannerengineering.com • Tel: 763.544.3164
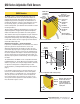
Color Sensitivity
The effects of object reflectivity on cutoff distance, though
small, may be important for some applications.
The excess gain curves on page 1 were generated using a white
test card of 90% reflectance. Objects with reflectivity of less
than 90% reflect less light back to the sensor, and thus require
proportionately more excess gain in order to be sensed with the
same reliability as more reflective objects. When sensing an
object of very low reflectivity, it may be especially important to
sense it at or near the distance of maximum excess gain.
It is expected that at any given cutoff setting, the actual cutoff
distance for lower reflectance targets will be slightly shorter
than for higher reflectance targets (see Figure 10). This
behavior is known as color sensitivity.
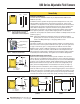
The percentage of deviation indicates a change in the cutoff
point for either 18% gray or 6% black targets, relative to the
cutoff point set for a 90% reflective white test card.
For example, the cutoff point decreases 10% for a 6%
reflectance black target when the cutoff point is adjusted for
2000 mm (80") using a 90% reflectance white test card. In
other words, the cutoff point for the black target is 1800 mm
(71") for this setting.
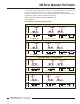
Setting the Output Delay
The output of the Q60AF sensor may be delayed between 0.008
and 16 seconds, in any of 72 increments. Delay is indicated on
the 5-segment light bar using single LED segments or
combinations of them, in varying stages of intensity. Major
increments, displayed by a single full-intensity LED, are shown
in Figure 13.
Figure 10. Cutoff point deviation
0
-1
-2
-3
-4
-5
-6
-7
-8
-9
-10
200 400 600 800 1000 1200 1400 1600 1800
2000
Cutoff Setting (90% White Card)
Percent Deviation
18% Gray Card
6% Black Card
Figure 11. Q60 minimum range vs. cutoff setting
150
140
130
120
110
100
90
80
70
60
50
200 400 600 800 1000 1200 1400 1600 1800
2000
Cutoff Distance (mm) with 90% White Card
Minimum Range with a 6% Black Card (mm)
Figure 12. Q60 hysteresis
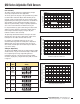
Figure 13. ON/OFF Delay options
2.5
3.0
2.0
1.5
1.0
0.5
0
200 400 600 800 1000 1200 1400 1600 1800
2000
Cutoff Setting (mm) with 90% White Card
Hysteresis (% of Cutoff) with 6% Black Card
Step
#
Delay
Time
0
No
Delay
8
0.062
second
24
0.250
second
40
1.00
second
56
4.0
seconds
72
16
seconds
DO
SIG
LO
DO
SIG
LO
DO
SIG
LO
DO
SIG
LO
DO
SIG
LO
DO
SIG
LO
LED
Status