
User guide


Table Of Contents
- Introduction
- Overview of ReadCenter Analytics and Analytics Mobile
- Program Startup
- Main Screen
- System Outline
- Fixed and Mobile Reading Cycles
- Save/Clear Reads
- Read Input File
- Apply Gateway Readings to the Customer Account Records
- Load Collectors
- Unload Collectors
- Route Reading Reports / Run Reports
- Write Output File
- Gateway Reading Reports
- Custom Reports
- Analytics
- Accounts and System Settings
- System Requirements
- Software Function Detailed Description
- Codes
- Using the Tool Bars
- Radix Handheld File Transfer
- ReadAll Handheld File Transfer
- Mini Mobile Interrogator (MMI) File Transfer
- Backup Operation
- Troubleshooting
- Technical Support
Gateway Reading Summary
ReadCenter Analytics
Analytics> Gateway Reading Summary
ReadCenter Analytics Mobile
n/a
Fixed Network Only: This section is intended for customers with a fixed network. Customers using ReadCenter Analytics
exclusively for a mobile network may skip this section.
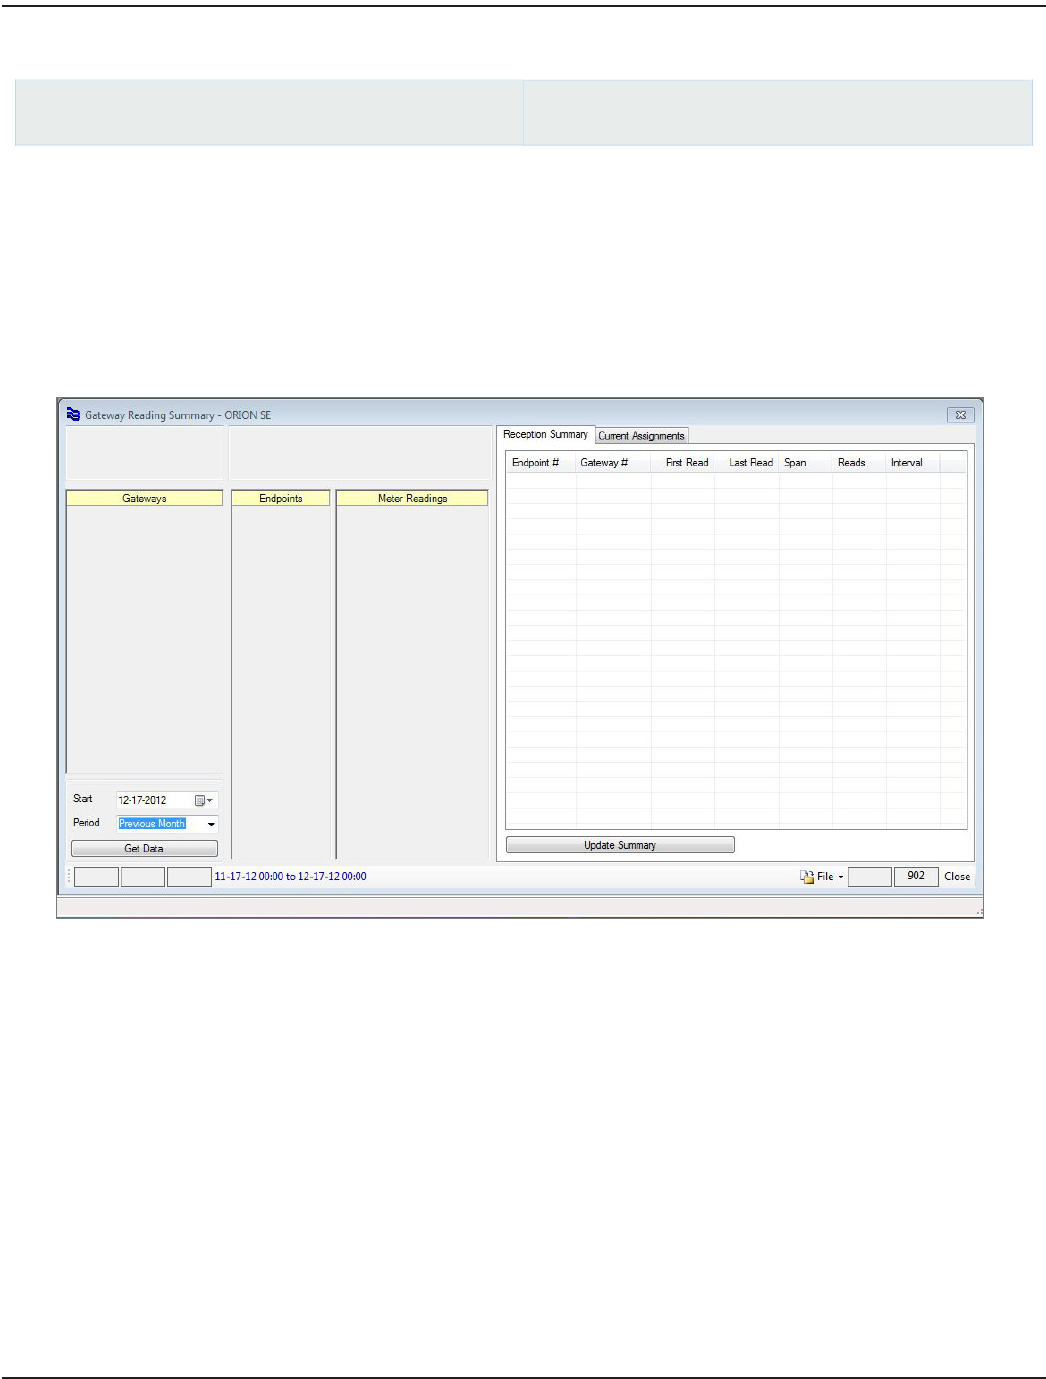
Use the Gateway Reading Summary function to view information retrieved from the receive log held within each ORION SE
gateway. The log is typically retrieved on a weekly basis. Information can be viewed to see the reception coverage of each
gateway. It can also tell whether endpoint activity is being received by multiple gateways.
1. Select a Start date using the drop-down menu on the left side of the screen, below the Gateways table.
2. Select a time period using the Period drop-down menu. In the screen example above, "Previous Month" is selected.
3. Click the Get Data button.
Result: The Gateways, Endpoints and Meter Readings tables on the left side of the screen ll with information for the time
period selected and the time period displays at the bottom of the screen.
4. Click the Update Summary button to view the data in the Reception Summary table on the right.
Result: All unique gateway/endpoint combinations for the time period selected are shown in the Reception Summary table.
The data shows which gateways are picking up the most endpoint activity and shows any endpoints that are reporting to
more than one gateway.
As you point to each gateway in the table, endpoints reported through the gateway during the time period specified are
shown in the Endpoints column. As you point to each endpoint in the table, meter readings reported by the endpoint are
shown in the Meter Readings column.
ReadCenter® Analytics & Analytics Mobile
Page 46 June 2014