
User guide

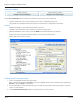


Table Of Contents
- Introduction
- Overview of ReadCenter Analytics and Analytics Mobile
- Program Startup
- Main Screen
- System Outline
- Fixed and Mobile Reading Cycles
- Save/Clear Reads
- Read Input File
- Apply Gateway Readings to the Customer Account Records
- Load Collectors
- Unload Collectors
- Route Reading Reports / Run Reports
- Write Output File
- Gateway Reading Reports
- Custom Reports
- Analytics
- Accounts and System Settings
- System Requirements
- Software Function Detailed Description
- Codes
- Using the Tool Bars
- Radix Handheld File Transfer
- ReadAll Handheld File Transfer
- Mini Mobile Interrogator (MMI) File Transfer
- Backup Operation
- Troubleshooting
- Technical Support
4. Click on an Endpoint Alarm or Usage Alarm in the Conditions eld on the left side of the screen.
The list of Endpoint Alarms and Usage Alarms in the Conditions eld is based on the selections made for the endpoint
types on the System Conguration screen (Tools> System Conguration).
When a Condition is selected from the list on the left, it displays in the Condition eld on the right side of the screen
where it can be further dened.
5. Dene a period of time for the account analysis.
Use the drop-down menu to choose an End Date. Then select the time period using the drop-down menu in the
Period eld
or
Check Use Date Range and then select Date From and Date To using the drop down menus.
OTE:N In the software, End Date is at midnight of the date selected. To get information for the current date as well,
select an End Date that is one day after the report time period. For example, if you want to see a report with
information through February 2, select February 3 as the End Date.
OTE:N As the date selections change, the resulting range is shown in blue in the tool bar.
6. Select a qualier ("Greater Than," "Less Than") from the drop-down menu. This eld is labeled "IS" for Usage Alarms and
changes to "Occurs" for Endpoint Alarms.
7. Use the up and down arrows to dene the number of units or number of times the Condition must have occurred
within the dates selected. This eld is labeled "Units" for Usage Alarms and changes to "Times" for Endpoint Alarms.
8. Click View Report to see a report with the criteria specied. A sample report is shown here.
Show Records - Select an account and click Show Records to see the Account Records screen for the account.
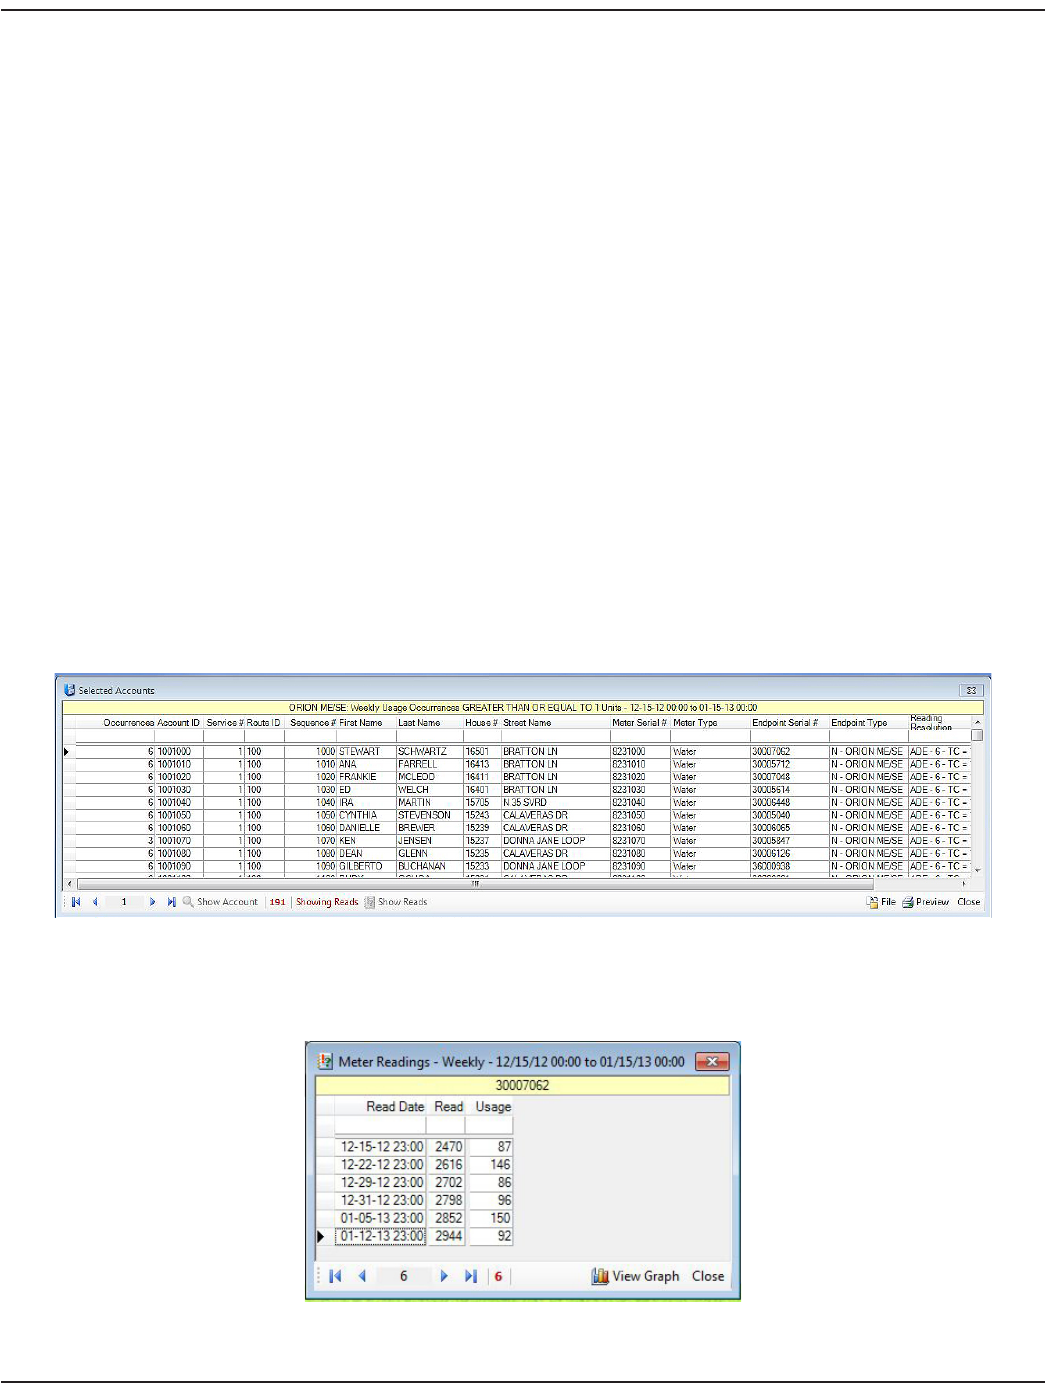
Show Reads - Select an account and click Show Reads to see the readings for the selected time period. In this view,
a graph of the reads is also available.
User Manual
Page 43 June 2014