
User guide


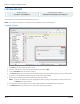


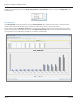
Table Of Contents
- Introduction
- Overview of ReadCenter Analytics and Analytics Mobile
- Program Startup
- Main Screen
- System Outline
- Fixed and Mobile Reading Cycles
- Save/Clear Reads
- Read Input File
- Apply Gateway Readings to the Customer Account Records
- Load Collectors
- Unload Collectors
- Route Reading Reports / Run Reports
- Write Output File
- Gateway Reading Reports
- Custom Reports
- Analytics
- Accounts and System Settings
- System Requirements
- Software Function Detailed Description
- Codes
- Using the Tool Bars
- Radix Handheld File Transfer
- ReadAll Handheld File Transfer
- Mini Mobile Interrogator (MMI) File Transfer
- Backup Operation
- Troubleshooting
- Technical Support
History Report Graph
From a History report, click the Graph button to see usage graph for an
endpoint for the time period selected. Use the drop-down menu to select All,
Hourly, Daily, Weekly, or Monthly readings.
OTE:N The Graph option is available whenever you run a History report.
An example of meter readings history in Graph view is shown below. The endpoint serial number is shown under the graph.
Buttons in Graph Tool Bar
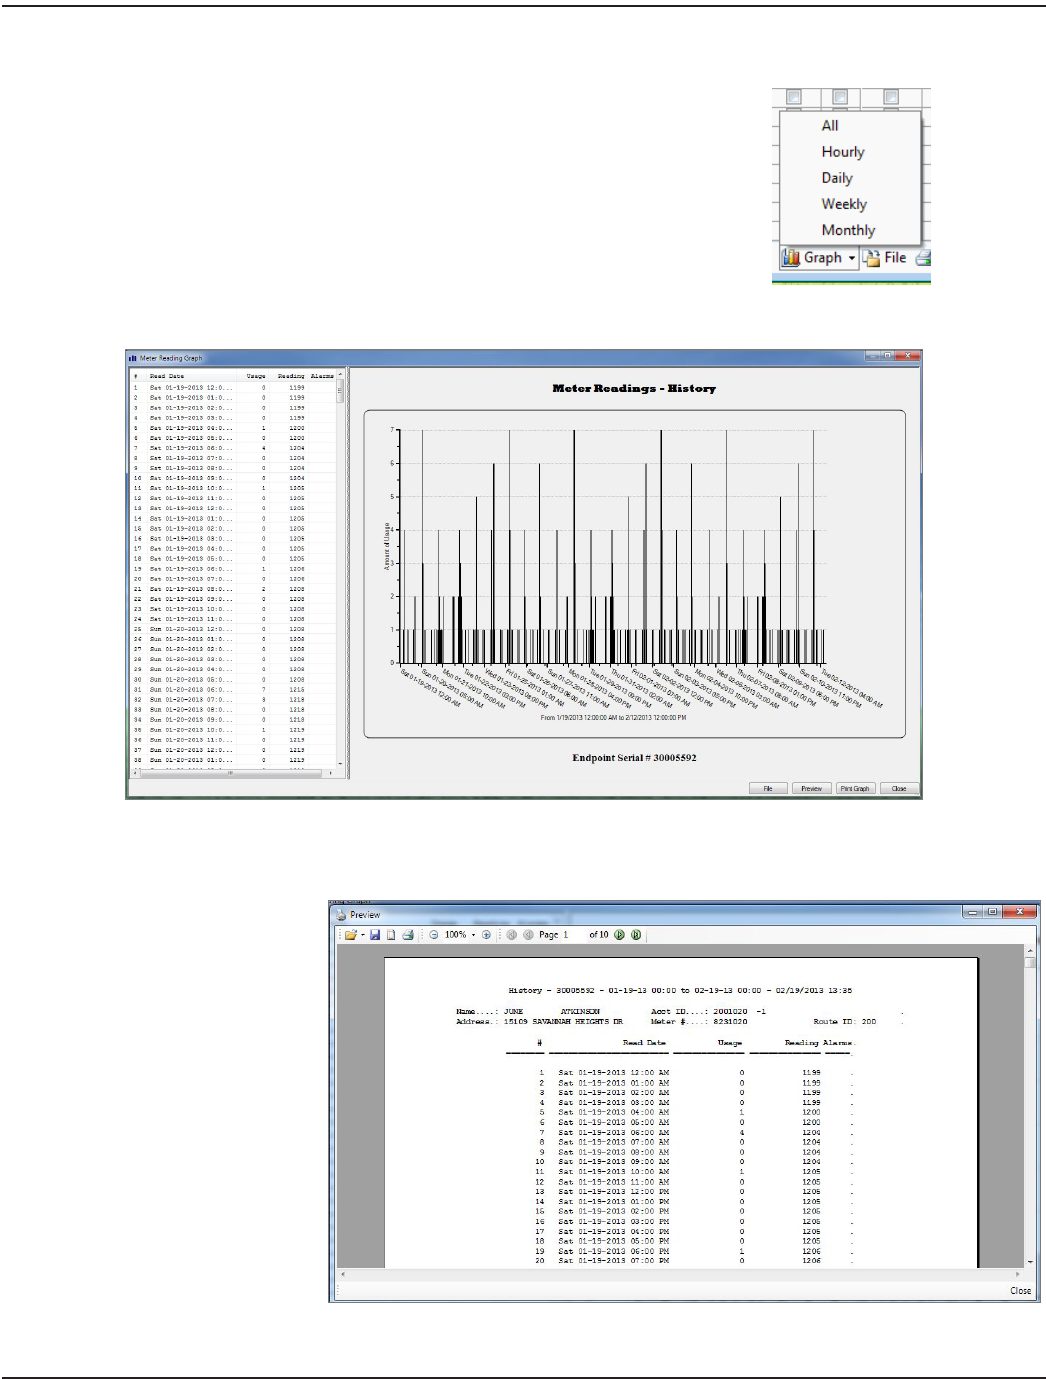
• Preview: Shows a report of the customer and usage information. (Includes print option.)
An example of the Preview
screen is shown here.
Click the Close button at
the bottom right to return
to the Graph view.
• Print Graph: Opens the
print dialog box to select a
printer.
ReadCenter® Analytics & Analytics Mobile
Page 32 June 2014