
Hardware Solutions for Gas Utilities


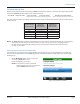
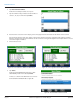

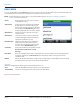
Table Of Contents
- Introduction
- User Guide
- Software Security Modes
- Program Startup and Exit
- Copyright Screen
- Main Menu
- Reading a Route
- Bookmark an Account
- Changing Read Mode
- Work Items
- Requesting Extended Status Manually
- Requesting Firmware Version Manually
- Requesting Historical Interval Data Manually
- Read Menu
- Comments
- Read Direction
- View High/Low
- Manual Read
- Select Route
- Reader Codes
- Trouble Codes
- Text Messages
- Utilities
- Customizations
- Route Info
- Program & Quick Read
- Part II: HandHeld Operation
- Trimble Ranger 3 Handheld Overview
- Factory Reset/Clean Boot
- Using the Handheld Keypad
- Hot Keys, Quick Keys, Read Keys
- Configuration Options
- APPENDIX
- Glossary
- Status Codes
- Valid COM Ports
- Gas Meter Drive Rotation
- Route Memory Stick
- Unloading a Route
- Using VersaProbe with Bluetooth
- Troubleshooting
- Technical Support
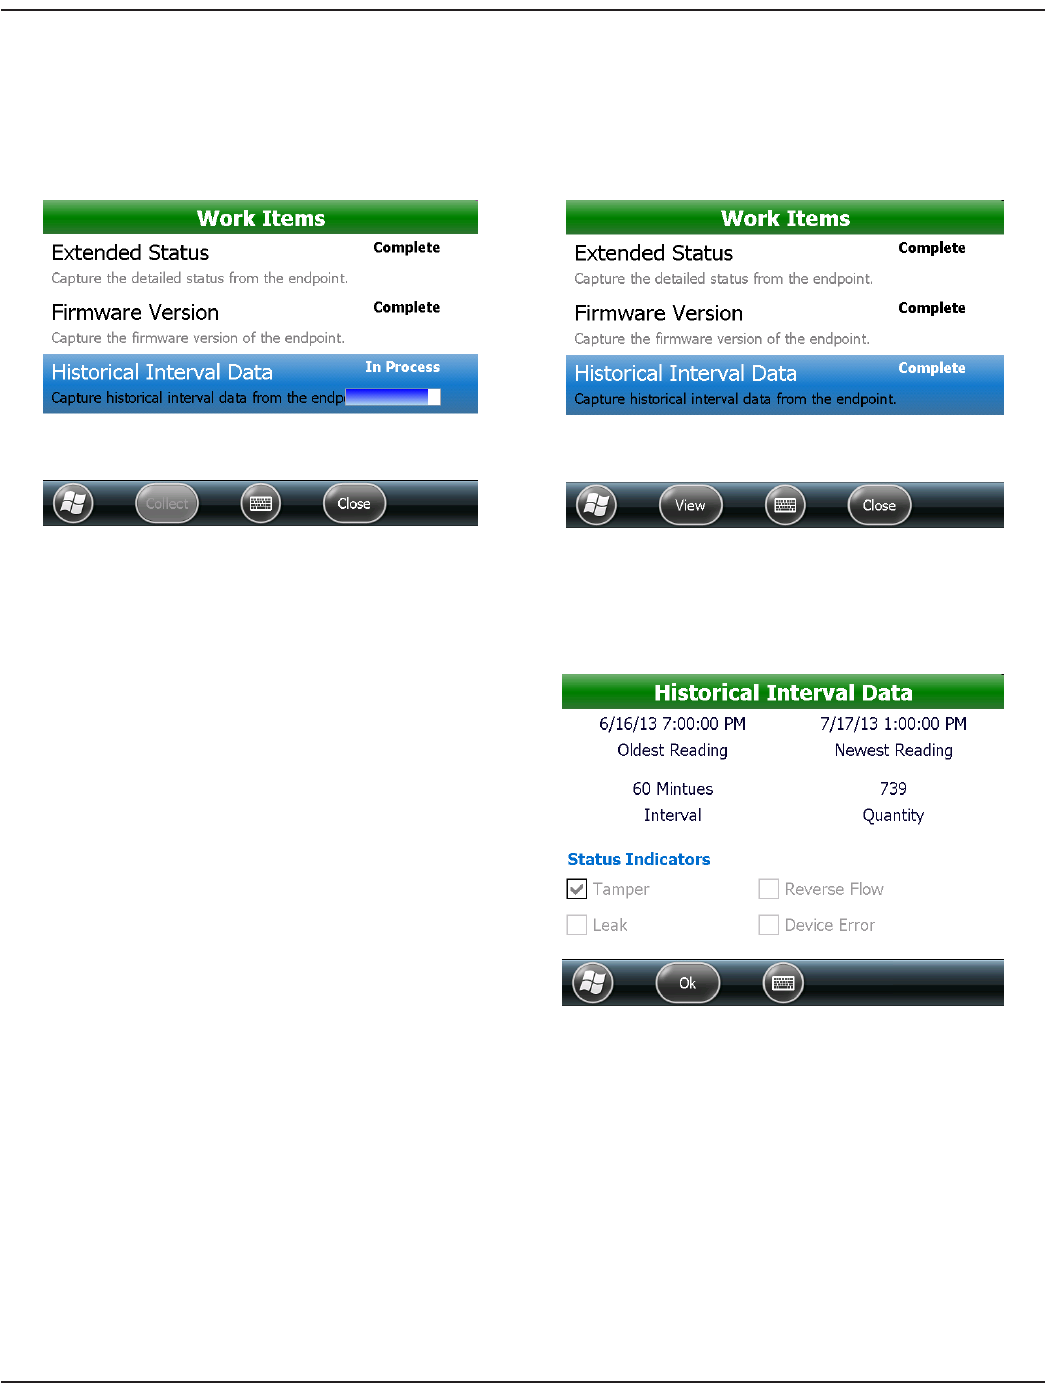
As the data is requested and extracted from the endpoint, a progress bar displays as shown in Figure 41.
”Complete“ displays when the historical interval data collection is finished and the View button becomes active.
See Figure 42.
OTE:N If you receive an error before the process completes, change your position and try collecting the data again.
Figure 41: Data collection ”In Process“
Figure 42: Data collection ”Complete“
7. Tap View.
Result: The Historical Interval Data screen displays with the endpoint historical data for the number of days selected.
• Date/Time: The start and end dates and times
of the data extraction.
• Interval: 60 or 15 minutes, depending on
whether the endpoint is set to read every 60
minutes (hourly) or every 15 minutes.
• Quantity: The number of reads extracted.
• Status Indicators: Any alerts found for the
period selected.
8. Tap Ok to return to the Work Items screen.
9. Tap Close to return to the account read screen.
Figure 43: Historical profile data results
READING A ROUTE
Page 29 April 2014 ORION® Field Application for Trimble® Ranger 3