
Specifications


7
linear, resulting in laboratory measured correlation coefficient using a least squares regression of
r = 0.99995. There is an offset adjustment on the front control panel that allows the user to
select the output count for zero input light or dark count. It is important to set this to a positive
count of around five a gain setting of 1 and a 1 second integration time. This insures that if the
electrometer amplifier drifts slightly, the dark count will still be above 0. If the offset drifts to a
negative value, a reading of the dark count will show nothing on the display - the display will be
dark.
The gain of the voltage-to-frequency converter has three selectable settings of 1, 10 and 100.
Based on a selected gain of 10, the output frequency of the voltage-to-frequency converter is
equal to
F
out
= E
out
* 3x10
4
Hz/V
where E
out
is the output voltage from the electrometer stage. The maximum output frequency is
about 15KHz before saturation .
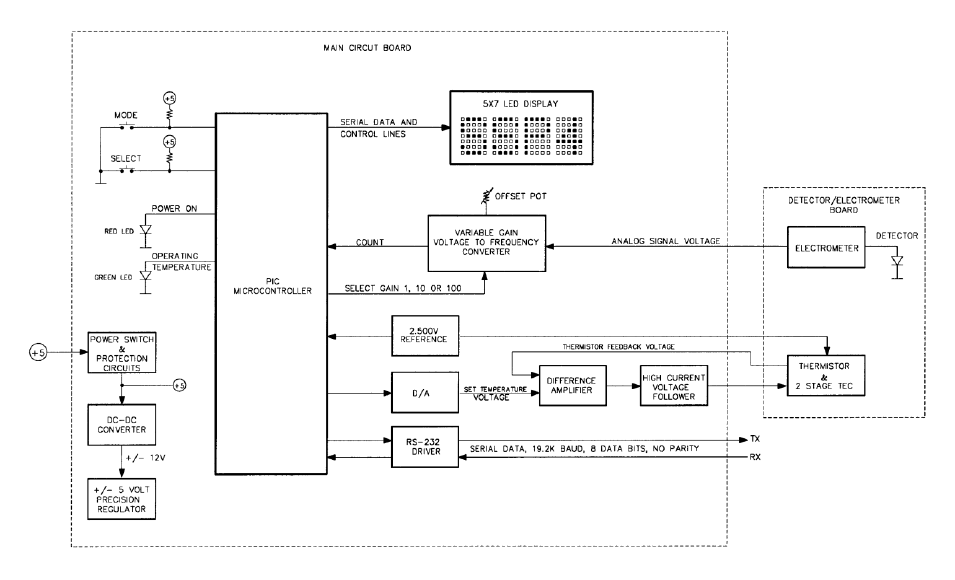
Figure 2.3 shows a functional diagram of the signal processing circuit and Figure 2.4 shows the
placement of the front panel controls.
Figure 2-3. Signal Processing Diagram