
User`s guide


Analysis
OB Growth Curves
10-16 Revision D.0
Displaying OB Graphs for Multiple Fetuses
You can graph up to three fetuses on one display. By observing the different
markers for each fetus (X for Fetus A; O for Fetus B; D for Fetus C), you can
compare the data among the fetuses as well as between each fetus and the
established-norm curves. You must specify the number of fetuses in the patient
ID to enter and display data for more than one fetus. Data from only one study
can be represented on any one graph at a time. If there is more than one
calculation for a biometry, only the calculation that contributes to the AUA is
plotted. If you have used different calculations to contribute to the AUA for
different fetuses, a window allows you select which calculation to use. For
example, if fetus A uses GA(BPD) Hadlock and fetus B uses GA(BPD) Jeanty, a
window appears offering a choice between the two.
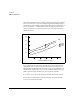
The following illustration shows a sample gestational graph for triplets.
15
10.0
8.0
6.0
4.0
2.0
2520 30
Gestational Ages (weeks - LMP)
BPD
35
Fetus A
Fetus B
Fetus C
GA (BPD) Hadlock