
User`s guide


Analysis
OB Growth Curves
Revision D.0 10-15
ssn February 10, 1999 C:\WINNT\Profiles\dapowell\Desktop\D.0 Books\CD FILES SONOS
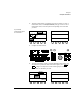
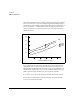
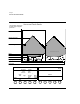
Displaying Obstetrical Growth Graphs
SONOS displays obstetrical growth graphs for configured gestational age
calculations. When appropriate data is acquired, SONOS plots a fetus on the
graph. If data has not been acquired to produce a graph, the system displays the
normative curves with the text NO DATA at the top left of the graph.The
following figure shows the obstetrical growth graph controls.
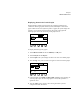
To display obstetrical growth graphs:
1. Touch OB/GYN Exam and then the OB Early or OB preset.
2. Touch Analysis and then Report.
3. Touch Graphs. The system displays the first in the series of available graphs.
4. Turn the Page rotary control, which now appears to select the desired graphs.
5. If this is an EFW, touch EFW vs LMP or EFW vs AUA to select whether you
want the graph to plot the fetal weight against a GA (LMP) parameter or
against the AUA.
6. Turn the Author rotary control to select among the authors you have
configured for EFW calculations.
Results
Box
Analysis
Report
Graphs
Analysis
Graphs
Page
1/12
EFW vs
LMP
Author
1/2