
User`s guide


Analysis
OB Growth Curves
10-14 Revision D.0
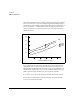
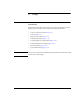
The following illustration shows a sample gestational age graph. Each biometry
has its own growth curve. The curves displayed represent the 50th percentile
gestational ages from established studies. Depending upon the measurements in
use, curves showing +/- standard deviation from the 50th percentile are also
shown. The middle curve is the norm, and curves on each side represent the
standard deviations.
If an expected GA has been entered, then that value is used to determine the
values shown on the x-axis. If no expected GA has been entered, but a Last
Menstrual Period (LMP) has been entered, the x-axis uses the LMP value. For
estimated fetal weight (EFW), you can choose to display EFW against age by
LMP or against average ultrasound age (AUA) if both are available.
If you want to use the GA (LMP) parameter, an LMP value must be entered.
If more than one measurement is made for a biometry, the system plots the
average value for that measurement.
15
10.0
8.0
6.0
4.0
2.0
2520 30
Gestational Ages (weeks - LMP)
BPD
35
Fetus A
Fetus B
Fetus C
GA (BPD) Hadlock