
User`s guide


Analysis
OB Growth Curves
Revision D.0 10-13
ssn February 10, 1999 C:\WINNT\Profiles\dapowell\Desktop\D.0 Books\CD FILES SONOS
OB Growth Curves
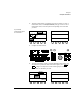
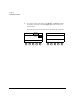
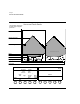
You can display growth graphs for obstetrical studies (obstetrical presets only).
The resulting growth curves plot gestational age (GA) on the x-axis against the
measurement upon which the derived age is based (for example, BPD) on the
y-axis. X, O, or D is used when there are multiple fetuses:
•X = baby A
• O = baby B
• D = baby C
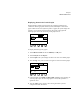
The fetuses are all part of the same study. The study is referred to by the patient
ID, which should be the mother’s name.
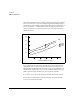
The fetus under study (X, O, or D) is plotted against the normative curves shown
on the graphs. The type of calculation plotted depends on your Obstetrics
Calculation setup and the measurements you make. You can display growth
graphs for up to three fetuses.