
User's Manual

18
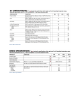
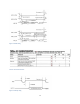
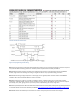
Note 7: Per-pin I/O types are provided in the Pin Functions section.
Note 8: VIH maximum voltage input must respect the VSUPPLY maximum voltage specification.
Note 9: The analog inputs to the ADC can be modeled as a series resistor to a capacitor. At a minimum the entire circuit,
including the source impedance for the signal driving the analog input should be designed to settle to within ¼ LSB within the
sampling window to match the performance of the ADC..
Note 10: Network time accuracy is a statistical measure and varies over the temperature range, reporting rate and the location
of the device relative to the manager in the network. See the Typical Performance Characteristics section for a more detailed
description.
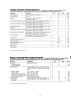
Note 11: Code execution from flash banks being written or erased is suspended until completion of the flash operation.
Note 12: Guaranteed by design. Not production tested.
TYPICAL PERFORMANCE CHARACTERISTICS
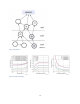
Network motes typically route through at least two parents the traffic destined for the manager. The
supply current graphs shown in Figure 8 include a parameter called descendants. In these graphs the
term descendants is short for traffic-weighted descendants and refers to an amount of activity
equivalent to the number of descendants if all of the network traffic directed to the mote in question.
Generally the number of descendants of a parent is more typically 2x or more, than the number of
traffic-weighted descendants. For example, with reference to Figure 7, Network Graph mote P1 has 0.75
traffic-weighted descendants. To obtain this value notice that mote D1 routes half its packets through
mote P1 adding 0.5 to the traffic weighted descendant value; the other half of D1’s traffic is routed
through its other parent, P2. Mote D2 routes half its packets through mote D1 (the other half going
through parent P3), which we know routes half its packets to moteP1, adding another 0.25 to the traffic-
weighted descendant value for a total traffic-weighted descendant value of 0.75
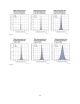
As described in the Application Time Synchronization section, WSM2400 provides two mechanisms for
applications to maintain a time base across a network. The synchronization performance plots that
follow were generated using the more precise TIMEn input. Publishing rate is the rate a mote
application sends upstream data. Synchronization improves as the publishing rate increases. Baseline
synchronization performance is provided for a network operating with a publishing rate of zero. Actual
performance for applications in network will improve as publishing rates increase. All synchronization
testing was performed with the 1-hop mote inside a temperature chamber. Timing errors due to
temperature changes and temperature differences both between the manager and this mote and
between this mote and its descendants therefore propagated down through the network. The
synchronization of the 3-hop and 5-hop motes to the manager was then affected by the temperature
ramps even though they were at room temperature. For 2°C/minute testing the temperature chamber
was cycled between –40°C and 85°C at this rate for 24 hours. For 8°C/minute testing, the temperature
chamber was rapidly cycled between 85°C and 45°C for 8 hours, followed by rapid cycling between –5°C
and 45°C for 8 hours, and lastly, rapid cycling between –40°C and 15°C for 8 hours.