
Owner's manual

11
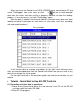
Interface. For better result, the user may close the panel window.
Graph
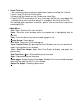
Tool Bar
- Display or hide Statistic1.
- Display or hide Statistic2.
- Normal cursor.
- When selected, the mouse cursor will become a cross sign when
moving to the graph, click on the graph to mark a cross sign on the
graph.
-
When selected, the mouse cursor will become an "I" sign when
moving to the graph, click on the graph to annotate.
- Color graph.
- Monochrome graph.
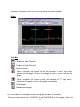
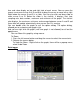
You can choose a rectangle area on the graph to zoom in for detail.
There are two vertical lines (CURSOR A and CURSOR B) in the graph. There are