
Programming instructions
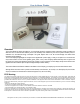

IHD features
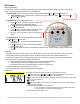
Using the Buttons
Once the device is turned on, all viewing and setup functions are done using the three buttons located on the front of the In-Home
Display. Viewing and programming instructions are described below.
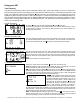
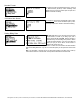
The right button ►moves from one view to another, normally cycling between the Main, History and Summary views.
● Press and Hold to jump to the main menu, preferences and system information; Select Exit to return to the Main,
History and Summary views.
Although efforts are made to provide accurate electricity cost information, ALL COSTS ARE ESTIMATES FOR INFORMATIONAL PURPOSES ONLY, NOT FOR BILLING.
The middle button
√ allows screen specific actions.
• In the Main views, pressing the button switches from
averaged consumption to instantaneous demand.
• In the History views, this button toggles between “Last 24
Hours” and “Last 30 Days”.
• In the Summary views, this button accesses the Reset
Summaries screen to reset the summary information.
• .Allows the unit to be turned off and on by pressing and
holding.
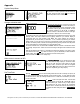
The left (UP) button ▲ allows additional information to be displayed
in the Main, History or Summary views.
• In the Main view, this button moves between the kW and
light bulb views.
• In the History views, this button moves between the kWh, $
and tier summary views.
• In the Summary views, this button moves between the Overall Summary, the Daily average compare and the Detailed
Summary.
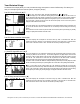
Light Bar
The Light Bar glows Red, Yellow or Green. The Light Bar light moves from left to right appearing to rotate at a rate that
corresponds to the amount of energy being consumed. The higher the rate of consumption, the faster the light will “turn”.
For Time-of-Use (TOU) the color is usually determined by the rate period and for volumetric use the colors are determined by
which block you are in as described in the typical example below.
• Green is typically used for the least expensive ($) TOU period or first volumetric block;
• Yellow is typically used for the mid-rate ($$) period or next volumetric block;
• Red is typically used for the most expensive ($$$) TOU period or volumetric block.
For single rate applications, the light bar glows one color only.
For more information about rates, see Electricity Rates in the Appendix.
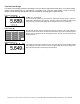
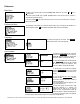
Status line
The top status line (outlined in yellow)on this summary screen indicates the following:
MHS -Three possible views- Main, History or Summary. The highlighted letter is the current view.
Today’s date. This value is obtained automatically from the smart meter.*
An antenna icon indicates connection is established. When flashing, the signal is weak. When
there is no icon, the signal is lost.
AC indicator
Battery indicator. Note: A solid battery icon indicates battery operation only, not the amount of
charge remaining in the battery.
The present rate period indicator symbol is displayed
• eg. For TOU rates: $ = Off-Peak, $$ = Mid-Peak, $$$ = Peak, $$$$ = Critical Peak.
• eg. For volumetric $ = first block $$ = next block $$$ = etc.
* User entry required except for REX2 meters