
Trouble Shooting Guide
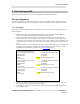
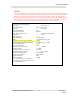
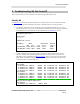
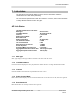
Table Of Contents
- Troubleshooting-Installing an RF link
- Issue : 5.3.x
- Authors : Matt Olson/Dave Sida
- Date : 30th July 2004
- CONTENTS
- CHANGE HISTORY
- INTRODUCTION
- Aligning an SU
- Fine tuning an SU
- SU signal quality
- Troubleshooting SU link from AP
- Link status
- AP Link Status
- SU Link Status
- MAC type
- Unit MAC address
- Channel
- Radio Channel Mask
- Correlation sequence
- MAC delay compensation
- Unit Range
- Base Station ID
- Radio Temperature
- RSSI
- Path loss in excess of FSL (estimate)
- Downlink RSSI Fade Margin
- TX maximum backoff
- TX current backoff
- Max TX power for channel
- Actual TX power
- Averaging MAC error rates over
- Downlink Header Error Rate
- Downlink Cell Error Rate
- Uplink Cell Error Rate
- Modem RSSI
- Mac stats
- Modem txpower
- Modem mmse
- PNMS Sector
- Survey Scan
- Modem msreg 6 1
- Modem rxdc stats
- Bun list channels

Axxcelera Broadband
Troubleshooting-Installing an RF link - 18 - Issue: 5.3.x
Rev 2
7.1.6 Radio Temperature
Radio Temperature displays the internal temperature of the radio in degrees Celsius. It is followed by an
indicator to tell you if the temperature is acceptable. Possible indicators are good, marginal and bad.
7.1.7 TX maximum backoff
TX maximum backoff displays the maximum system backoff that can be placed in the system.conf file for
a given band.
7.1.8 TX current backoff
TX current backoff displays the system backoff that is currently in the unit. This number is defined by the
value set in the system.conf file. Axxcelera recommend that the AP and all SUs in a sector have the same
backoff value.
7.1.9 Max TX power for channel
Max TX power for channel displays the maximum power in dBm that can be transmitted from the radio.
The power limits set by the FCC are; high band = +14dBm, mid band = +8dBm, low band = +1dBm.
7.1.10 Actual TX power
Actual TX power is the power level that the radio is actually transmitting at. For an AP this should be very
close, but slightly below the Max TX power value. It should fluctuate by less than 0.5dB over time.
7.1.11 Averaging MAC error rates over <period>
Averaging MAC error rates over <period>, displays the number of seconds during which the MAC stats are
calculated. The default is 2 seconds, but this can be changed by adding the number of seconds desired to
the link status command (i.e. “link status 10”). Be careful not to put to large of number here because the
console is locked while these calculations are taking place.
7.1.12 Aggregate Downlink Cell Error Rate
Aggregate Downlink Cell Error Rate is the downlink cell error rate for the entire sector. This is displayed in
% and for an AP it is based on CELL TX and tx values from the AP’s MAC stats. It is followed by an
indicator to tell you if the aggregate error rate is acceptable (although individual AP-SU links may still
have unacceptable error rates). It is actually measuring the downstream cell retransmission rate, and
downstream cell retransmissions can be caused by either a downstream or upstream radio problem. From
the AP link status command alone it is not possible to determine which AP-SU radio link/links is/are
having a problem. A high value for this measurement simply means that at least one radio link supported
by that AP has a problem.
7.1.13 Aggregate Uplink Cell Error Rate
Aggregate Uplink Cell Error Rate is the uplink cell error rate for the entire sector. This is displayed in %
and is based on CELL RXOK, RXMISSED, and RXBAD values from the AP’s MAC stats. It is
followed by an indicator to tell you if the aggregate error rate is acceptable (although individual SU-AP
links may still have unacceptable error rates). This is actually measuring the percentage of cells received
in error, and this type of error indicates an upstream radio problem. From the AP link status command