
User manual


83
A
B
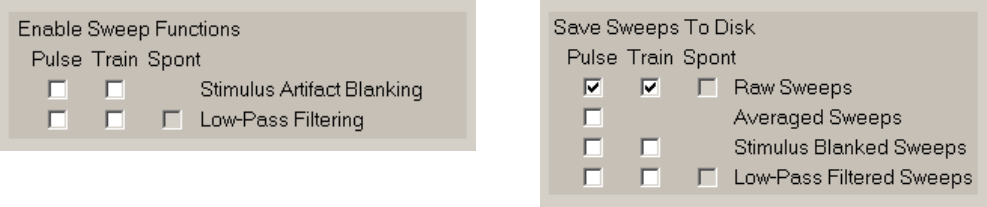
Fig. 4.5.1. A) Enable Sweep Functions panel in the MainProtocol tabsheet. B) Save Sweeps To Disk
panel in the Plot/Save tabsheet.
Single raw sweeps can either be (i) low-pass filtered, (ii) stimulus artifact blanked, or (iii) stimulus artifact
blanked and then filtered (Fig. 4.5.2a) (but not first filtered and then stimulus artifact blanked). The insets
in Fig. 4.5.2a show a patch-clamp recording of an EPSC from one raw sweep (left trace) showing
substantial noise and a large stimulus artifact at the left of the trace, the sweep that has been digitally
filtered to reduce the noise (note the large filtered artifact, right top trace), the sweep with the stimulus
artifact removed (middle trace), and the stimulus artifact blanked sweep that has then been filtered (right
bottom trace).
Alternatively, raw sweeps can first be (i) signal averaged, then this signal averaged sweep can either be
(ii) low-pass filtered, (iii) stimulus artifact blanked, or (iv) stimulus artifact blanked and then filtered (Fig.
4.5.2b) (but not first filtered and then stimulus artifact blanked). The insets in Fig. 4.5.2b show EPSCs
from two raw sweeps showing substantial noise and a large stimulus artifact (left traces), the signal
averaged sweep also with a large stimulus artifact (2
nd
trace) obtained from the two raw sweeps, the
signal averaged sweep that has been digitally filtered (right top trace), the signal averaged sweep with the
stimulus artifact removed (3
rd
trace), and the averaged, stimulus artifact blanked sweep that that has been
filtered (right bottom trace).
All these traces can be shown on the screen and saved to a data file. Calculations of slopes and peaks
are made on the latest processed sweep. For example, if signal averaging, stimulus artifact blanking and
digital filtering are being used, then the averaged, blanked and filtered sweep is the one that will be
analyzed.