
User manual


65
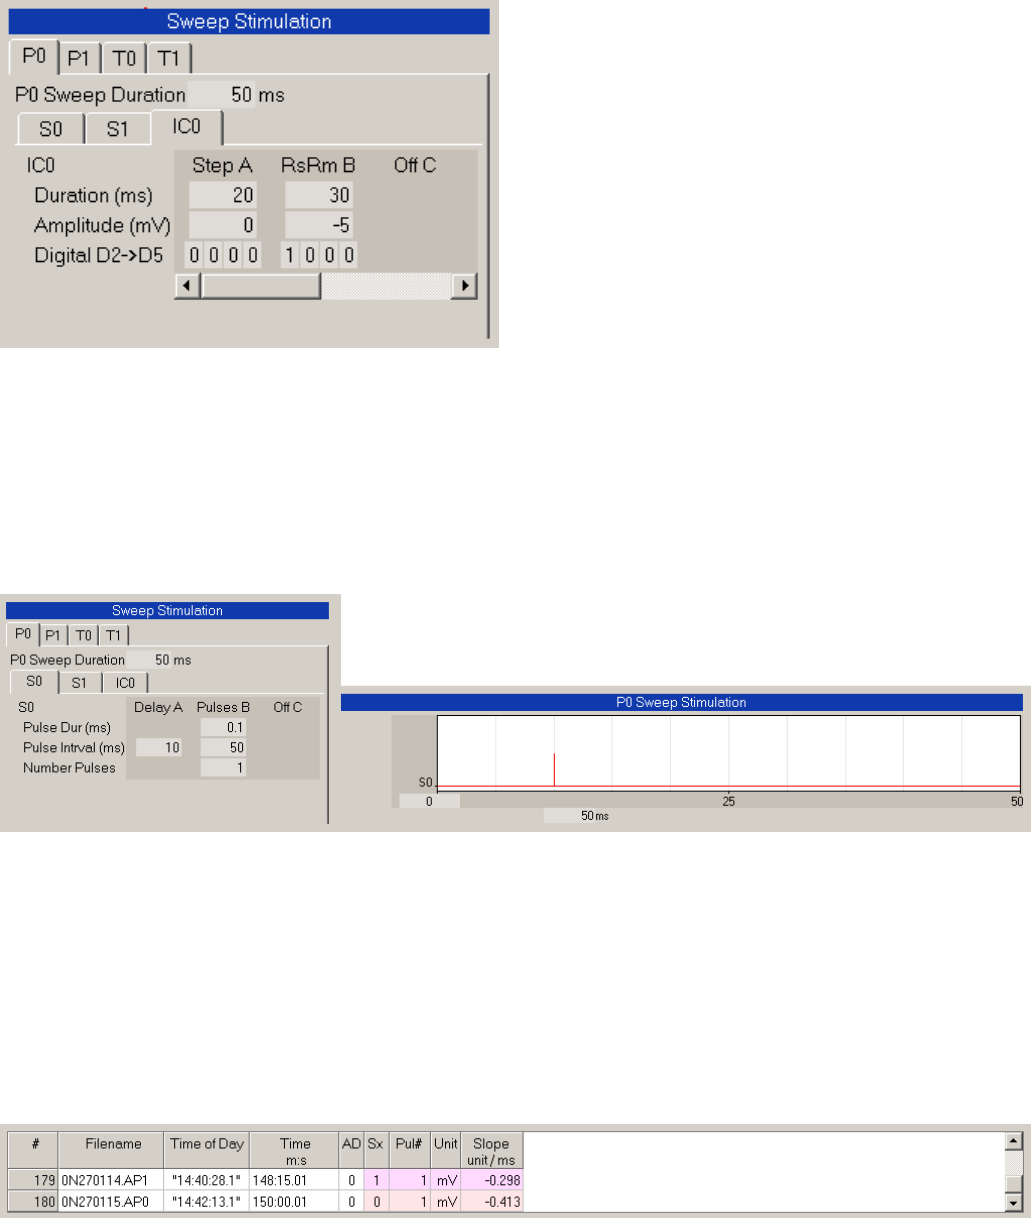
Fig. 3.1.3.2. IC0 stimulation fields.
Note that the Field Sweep Stimulation area is functionally coupled with the Graph Stimulation area, so
that when you click on the P0 tabsheet in the Field Sweep Stimulation area, the P0 Sweep Stimulation
graph comes up (Fig. 3.1.3.3). And when you click on the T0 tabsheet in the Field Sweep Stimulation
area, the T0 Sweep Stimulation graph comes up, and so forth.
Fig. 3.1.3.3. Field and Graph Sweep Stimulation Areas are coupled.
3.1.4 Spreadsheet Area
The Spreadsheet contains from zero number of lines to the maximum number of lines that can be visible
(Fig. 3.1.4.1).
Fig. 3.1.4.1. Spreadsheet. Only the Slope analysis column is shown.
The columns include
a) Calculation Number
b) Filename of the ADsweep data file