
User manual


59
3.1.1 MainPg/AnalysisPg Tabsheet Area
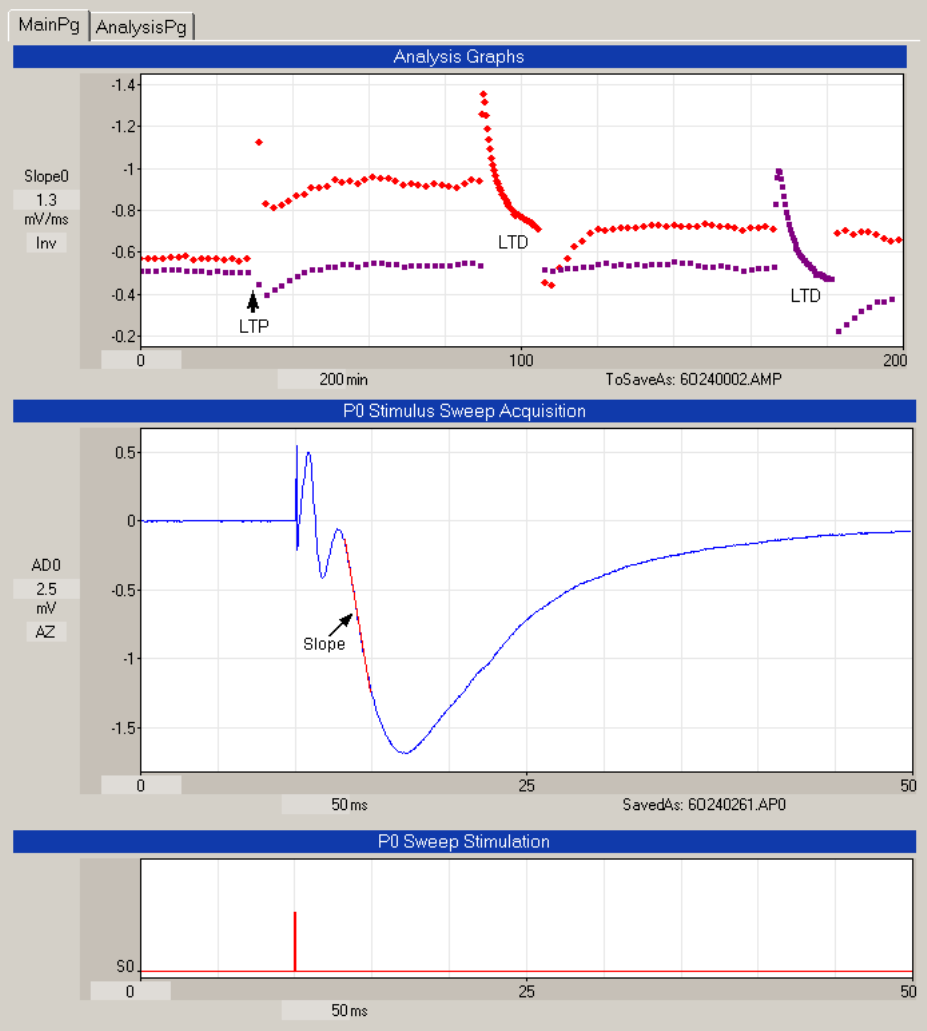
The upper right corner of the program shows the MainPg and AnalysisPg tabsheets (Fig. 3.1.1.1). The
MainPg tabsheet consists of three areas, the Analysis Graphs panel (top here, but can also be placed on
the right) containing (currently) one to four Analysis graphs, the Acquisition area (middle) showing here
only one (P0) Stimulus Sweep Acquisition, although it can also show Continuous Acquisition,
Spontaneous Sweep Acquisition, and some or all the other stimulation sweeps (P1, T0 and T1 sweeps),
and the graph of the stimulation in the sweep (bottom).
Fig. 3.1.1.1. The MainPg/AnalysisPg tabsheet area. The MainPg contains Analysis graphs (top here,
although the can be on the right), Stimulus Sweep Acquisition graphs (middle), and Sweep Stimulation
graphs (bottom).