
User manual


54
Then use the menu command:
View -> Select Columns…
to call up the Select Columns dialog box and then select CPU Usage, Memory Usage, Peak Memory
Usage and any other you want such as, in this example, Base Priority and the number of Threads.
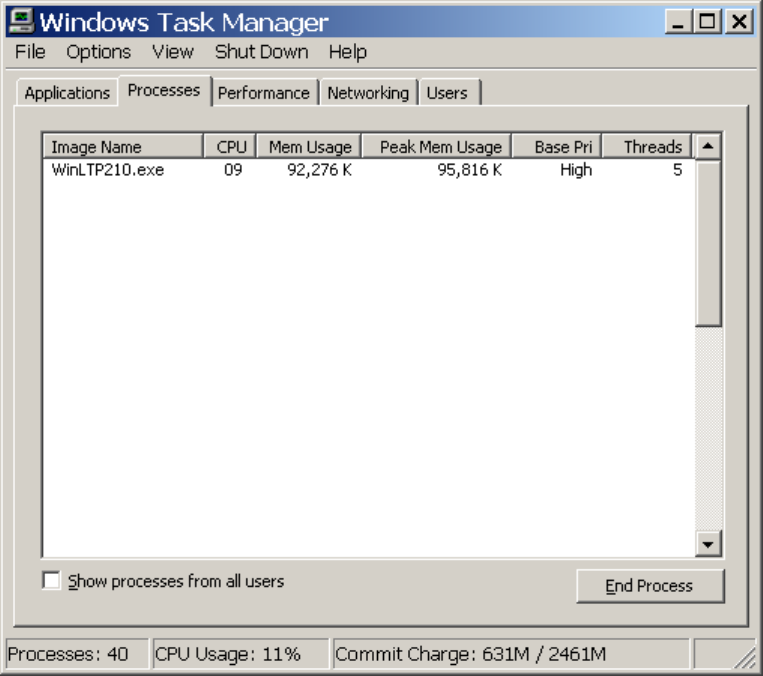
Fig. 2.17.1 shows a relatively low CPU usage of about 9% when running WinLTP with a Digidata 1322A
board on a 3.2 GHz computer (2AD channels at 50us sampling interval, Repeat Sweeps of 1 sec duration
with no delay between them, and Continuous Acquisition, with plotting on screen).
Fig. 2.17.1. Windows Task Manager showing CPU usage and Memory Usage, Peak Memory Usage
(and in this example also Base Priority and the number of Threads WinLTP is using). Note: all the other
processes have be ‘whited out’ for clarity.
CPU usage can also be seen graphically by clicking on the Performance tab (Fig. 2.17.2). Then use the
menu command:
View -> CPU History -> One Graph, All CPUs
to make sure the CPU Usage history graphs is one graph (with Windows XP, Vista, 7 or 8, a Pentium
CPU with HyperThreading can appear as two CPUs, but it is in fact one CPU).
Fig. 2.17.2 shows CPU usage increase when the Main Protocol is started and reaches a relatively high
CPU usage of about 50% when running WinLTP with a Digidata 1322A board on a 3.2 GHz computer
(2AD channels at 50us sampling interval, Repeat Sweeps of longer 5 sec duration with no delay between
them, and Continuous Acquisition, with plotting on screen).