
User manual


262
continue the reanalysis and reanalyse all the files (unless the ‘Pause’ button or the ‘Stop’ button is
pressed). The speed of reanalysis is still controlled by the ‘Reanalysis Period’ seconds field.
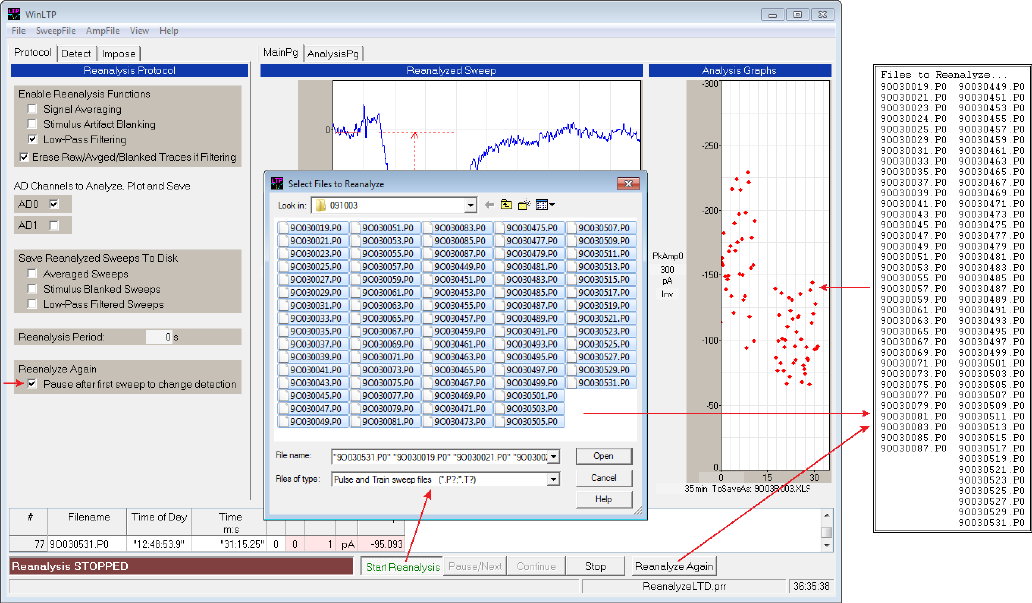
Fig. 15.10.1. Rapid reanalysis using the ‘Reanalyze Again’ button. Clicking the ‘Start Reanalysis button
calls the ‘Select Files to Reanalyze’ dialog box (lower left arrow). When a set of files is selected, they are
then loaded into a Files to Reanalyze list (middle right arrow) which then determines which files are then
reanalysed (upper right arrow). However, once the ‘Select Riles to Reanalyze’ dialog box has set the
Files to Reanalyze list, clicking the ‘Reanalyze Again’ button can then re-reanalyze the same files in the
‘Files to Reanalyze list (lower right arrow). The left arrow points to the ‘Pause after first sweep to change
detection’ check box.
If the ‘Pause after first sweep to change detection’ checkbox is unchecked, all the previously selected files
will be reanalysed with the current detection values (unless the ‘Pause’ button or the ‘Stop’ button is
pressed).
15.11 Save an ADsweep Graph as a Windows Enhanced Metafile
WinLTP cannot plot ADsweep graphs. However, it can save ADsweep graphs to vector based Enhanced
Metafiles that can be loaded into many other programs such as Microsoft PowerPoint, Excel and Word,
and SigmaPlot.
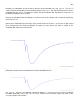
In order to save an ADsweep graph such as the one in Fig. 15.11.1 to an Enhanced Metafile, double-
click on the dark gray area of the individual ADsweep graph that contains the axis numbers, and this will
call up the Enhanced Metafile dialog box (Fig. 15.11.2).