
User manual


261
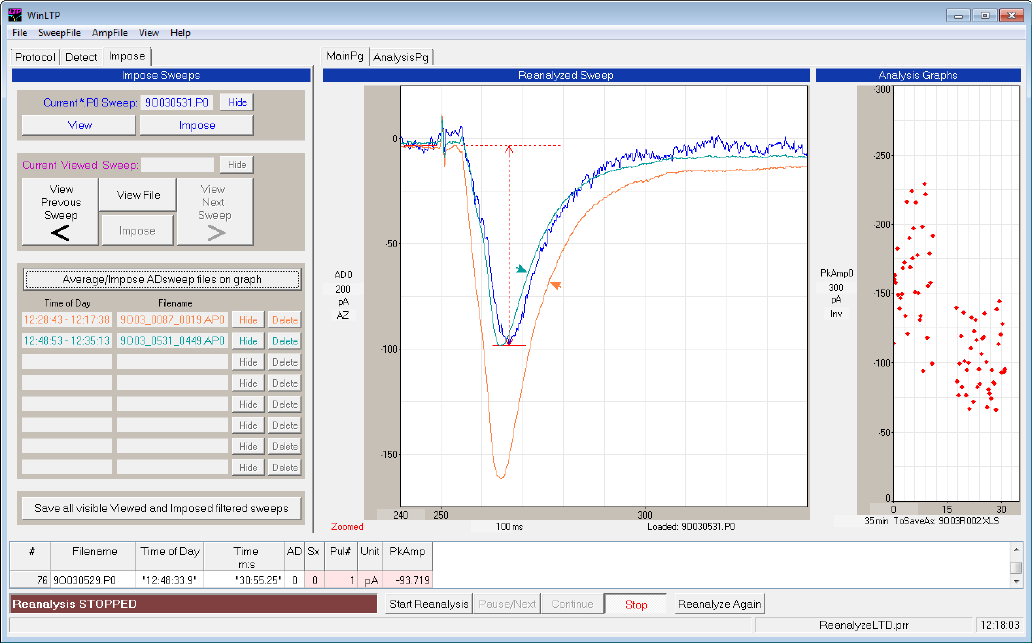
Fig. 15.9.3. Averaging all the sweeps prior to and after an LTD induction protocol (indicated by the blank
space in the peak amplitude graph). The last reanalysed sweep is shown in blue. The 35 averaged
baseline sweeps are plotted as a single orange trace (arrow) and printed as orange in the ‘Time of Day’
and ‘Filename’ fields. Similarly, the 42 averaged sweeps after LTD induction were plotted as a single
cyan trace (arrow) and printed as cyan in the ‘Time of Day’ and ‘Filename’ fields. All sweeps were filtered
to 1 KHz.
15.10 The ‘Reanalyze Again’ Button
In WinLTP 2.10 we have added a 'Reanalyze Again' button (lower right in Fig. 15.10.1) so that
you do not have to reselect the files to reanalyze. Prior to 2.10 if you wanted to reanalyze the
same set of files you had to click the ‘Start Reanalyze’ button and then reselect the files you
wished to reanalyze from the ‘Select Files to Reanalyze…’ dialog box. Now you just click the
‘Reanalyze Again’ button and it is as if you reselected all those files.
Since you are reanalyzing, presumably you have either already have changed a detection
parameter, or you wish to change a detection parameter. If you wish to change a detection
parameter for the next reanalysis, you can check the
[ ] Pause after first sweep to change detection
checkbox, so that after the ‘Reanalyze button’ is clicked, the first file is reanalysed, and then the
reanalysis is paused so that a detection parameter can be changed. This will then change the reanalysis
of the first file, and all subsequent files. You can then click the ‘Continue’ reanalysis button or press F3 to