
User manual


259
15.9 Viewing and Imposing Single and Averaged Sweeps During
Reanalysis
Viewing, and imposing single and averaged sweeps during reanalysis is essentially the same as doing so
during online acquisition (see Chapter 5).
The main difference is that the Current Sweep is determined by what files were selected for reanalysis by
the ‘Select Files to Reanalyze’ dialog box (Fig. 15.6.1) because the Current Acquired Sweep is obviously
only available in online acquisition. Furthermore, there is no need for the ‘Choose Filename Extension’
pulldown menu (Fig. 5.1) to set what file extension to use because that has already been determined
when the files were selected for reanalysis in the ‘Select Files to Reanalyze’ dialog box.
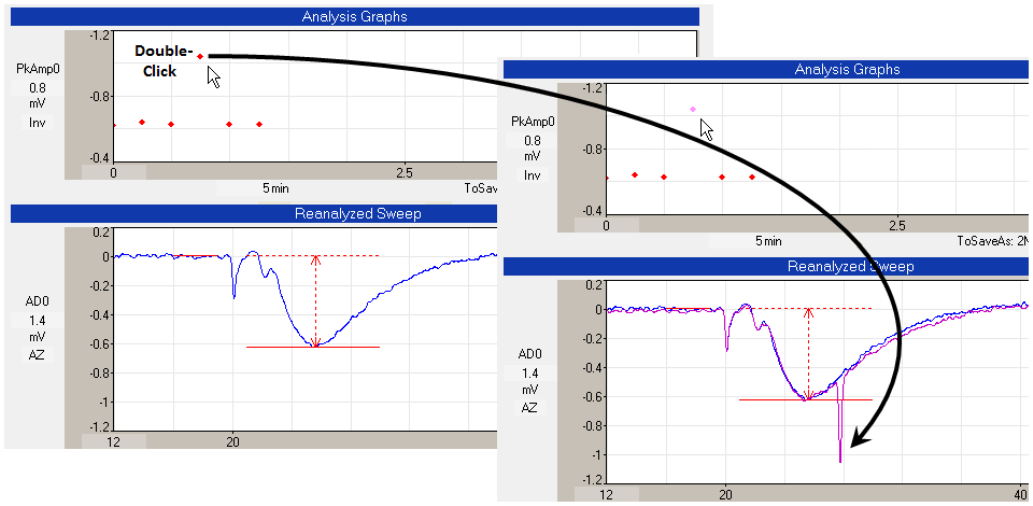
As with online acquisition (Section 5.2), double-clicking on an Analysis Graph data point will cause the
sweep that generated that data point to be Viewed (Fig. 15.9.1). This is particularly useful when wanting
to view the sweep from an earlier part of the experiment, or a sweep that generated an outlier data
point. It is also a simple way of finding the filename of the ADsweep file that generated a particular data
point. So, in addition, when an Analysis Graph data point is clicked to View a sweep, the entire ‘Impose’
tabsheet appears and the filename of the ADsweep file of that Viewed sweep also appears as the
‘Current Viewed Sweep’ (Fig. 15.9.2).
Fig. 15.9.1. Viewing a the single sweep generating the outlier data point. When the outlier data point in
the PkAmp0 Analysis Graph was double-clicked with the left mouse button, that sweep appears as the
magenta colored trace in the lower right hand graph (see black arrow). Note the large artefact that
caused the large peak amplitude calculation value and that the clicked point has changed from red to
magenta.