
User manual


254
Fig.
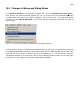
15.5.2. Layout of the WinLTP Reanalysis program with stimulation information coming from the Screen
Fields of the Stimulation Template. S1 stimulation is OFF. Note only S0 red triangles appear in the
Analysis graphs.
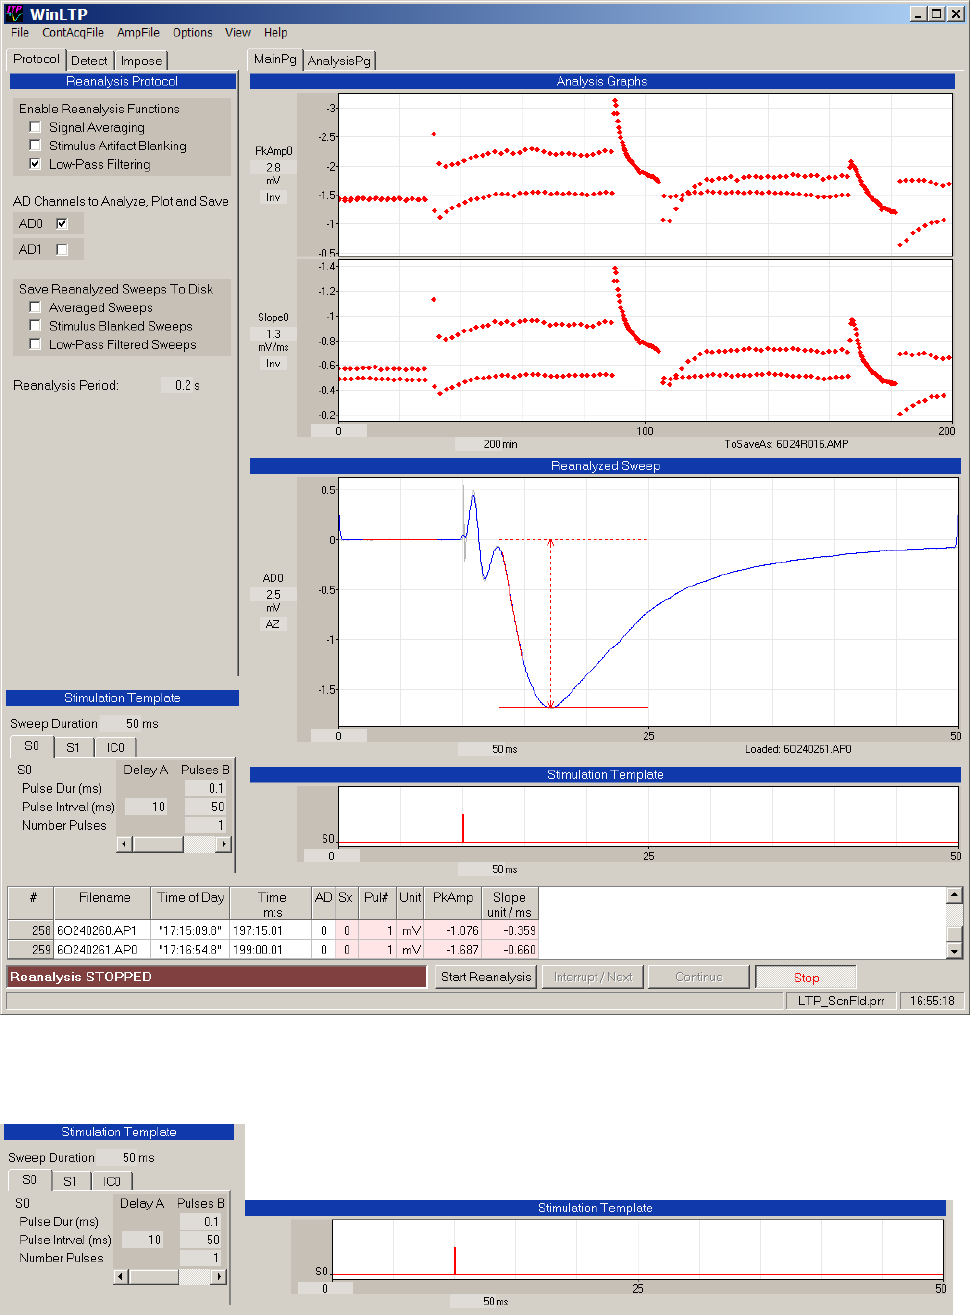
Fig. 15.5.4. The Stimulation Template consisting of Screen Fields on the left, and stimulation graphs on
the right (only S0 graph is used and shown). The key field is the ‘Delay A’ Pulse Interval (pulse delay)
field.