
User manual


248
15.4 Organization of the Reanalysis Program
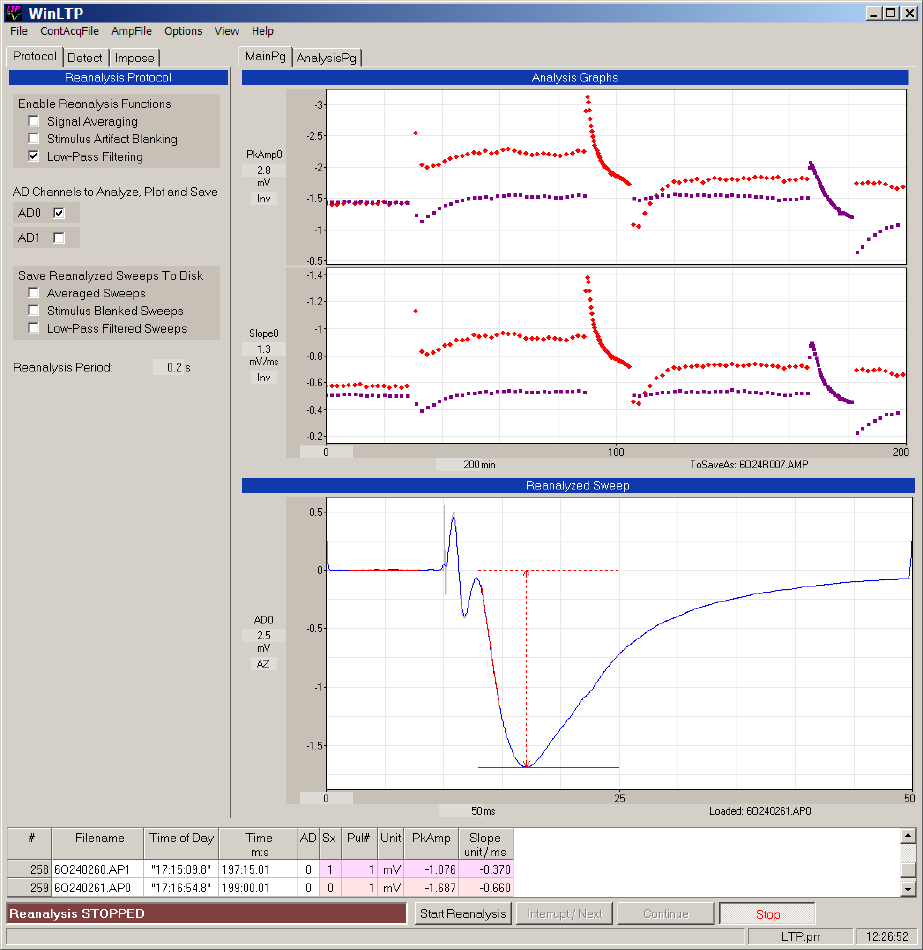
The layout of the WinLTP Reanalysis program (Fig. 15.4.1) is a simplification of the Online program.
Fig. 15.4.1. Layout of the WinLTP Reanalysis program showing the Reanalysis Protocol tabsheet (upper left panel),
Analysis Graphs (PkAmp and Slope, top right panel), Reanalyzed Sweep (middle right panel), and Spreadsheet and
Run Buttons (bottom panels). Detection fields are hidden behind the Reanalysis Protocol tabsheet. In this figure the
S0 and S1 pulse stimulation information is taken from the ADsweep disk file header, and therefore no sweep
Stimulation Template fields or graphs appear.
The Reanalyzed Sweep graph shows a fEPSP evoked by S0 stimulation (10 ms after the start of the sweep) with
a red lines showing the Slope and PkAmp. The slope graph shows calculations of slope for S0-evoked fEPSPs (red
triangles) and S1-evoked fEPSPs (magenta squares) caused by the alternating S0/S1 pathway stimulation produced
by alternating P0/P1 sweeps.
In the spreadsheet, “Time of Day” shows the time the sweep began, “Time m:s” shows the time of the stimulus
pulse from when analysis starts, “Sx” shows whether S0 or S1 stimulation was used, “Pul#” shows the number of the
S0 or S1 pulse that evokes the synaptic response, and “PkAmp” and “Slope” shows the calculated peak amplitude
and slope of the evoked response.