
User manual


242
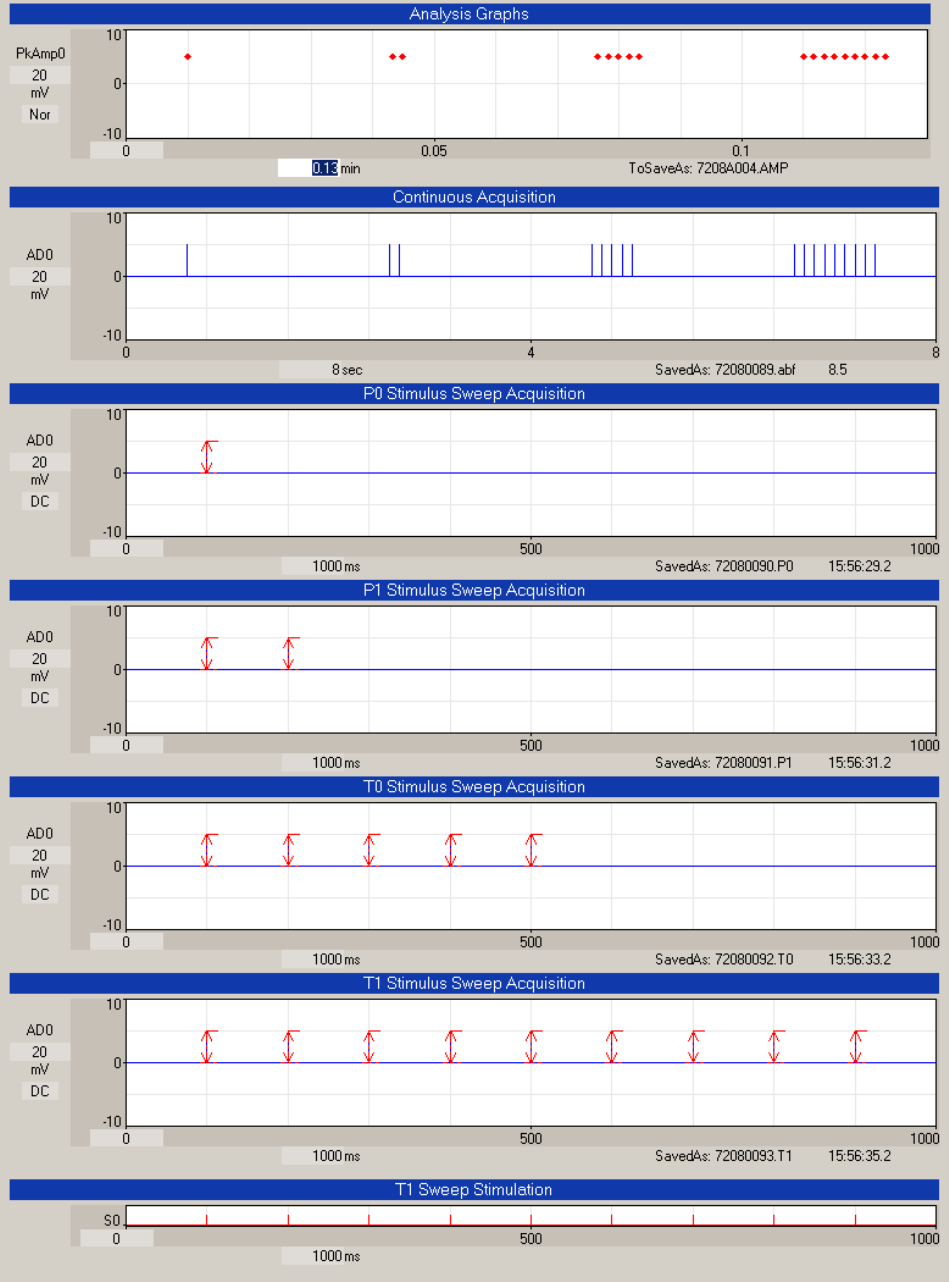
Fig. 14.4.2. The MainPg as it appears when the All Sweeps At Once is chosen from the Which
Stimulus Acquisition Sweeps dialog box. The top trace is a PkAmp0 Analysis Graph, followed by the
Continuous Acquisition trace, then the P0, P1, T0 and T1 Stimulus Sweep Acquisition Graphs, and finally,
at the bottom, the T1 Sweep Stimulation graph. Only channel AD0 has been plotted.