
User manual


239
14.2 Location of Analysis Graphs on the Main Page
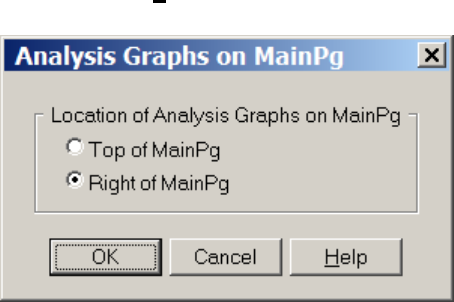
The Analysis Graphs on the MainPg can either be located at the top (Fig. 3.1.1) or on the right (Fig. 12.2)
of the MainPg. To change the location of the Analysis Graphs on the MainPg, call up the Location of
Analysis Graphs on MainPg (Fig. 14.2.1) by using the View menu command (Fig. 3.2.5) :
View -> Location of Analysis Graphs on MainPg…
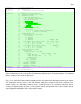
Fig. 14.2.1. Location of Analysis Graphs on MainPg dialog box.
14.3 Set the Number of Analyis Graph Columns on the Analysis
Page
On the AnalysisPage, there can either be up to 8 Analysis Graphs in two columns (Fig. 14.3.1.C) or up to
4 Analysis Graphs in one column (Fig. 14.3.1B). Therefore, adding the up to 4 Analysis Graphs on the
MainPg with the up to 8 Analysis Graphs on the Analysis Page gives a total of up to 12 Analysis Graphs
that can be viewed during online acquisition and reanalysis.
The number of columns on the Analysis Page can be chosen using the menu items
View -> Number of Columns on AnalysisPg…
to call up the Number of Columns on AnalysisPg dialog box (Fig. 14.3.1A).
Using this dialog box you can set set either B) one column with up to 4 Analysis Graphs on the Analysis
Page, or C) two columns with up to 8 Analysis Graphs on the Analysis Page. However, if you are using
only one column on the Analysis Page and you then choose 5 or more analyses in the Analysis To Do
dialog box, the num of columns will automatically increase to two.