
User manual


142
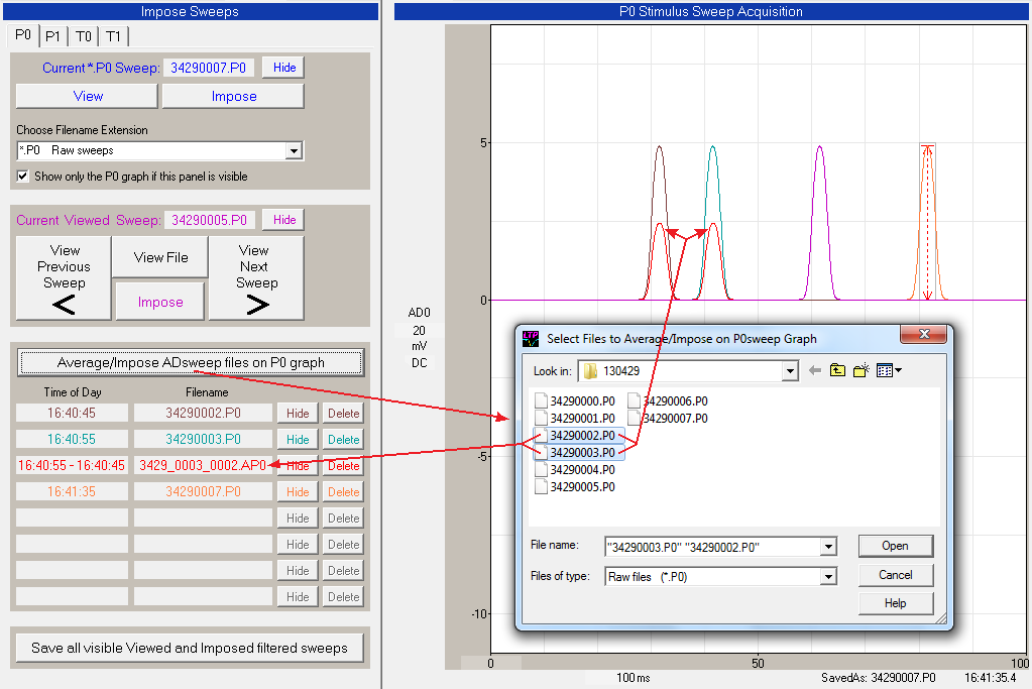
Fig. 5.4.1. Averaging many sweeps and imposing this average as a single sweep. This is done by
clicking on the ‘Average/Impose ADsweep files’ button (upper left red arrow) to bring up the ‘Select File to
Average/Impose’ dialog box, and then selecting two or more ADsweep filenames. In this example, the
earliest ‘0002’ sweep latest ‘0003’ sweep are then averaged, and this averaged sweep is then plotted (as
the red waveform, upper red arrows). This average sweep is also saved, and the latest ‘0003’ and
earliest ‘0002’ Times of Day and it’s Filename are printed in red the Imposed fields (lower left red arrow).
Averaging of many sweeps and imposing this as a single averaged sweep is particularly useful in
comparing special components of the baseline (orange trace in Fig. 5.4.2) like the fiber volley to that of
later sweeps taken in the experiment.