
User manual


138
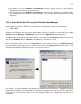
Fig. 5.2.1. Viewing a the single sweep generating the outlier data point. When the outlier data point in
the PkAmp0 Analysis Graph was double-clicked with the left mouse button, that sweep – including the
large artifact producing the large peak amplitude measurement – is superimposed as shown by the
magenta colored trace in the lower right hand graph (see black arrow).
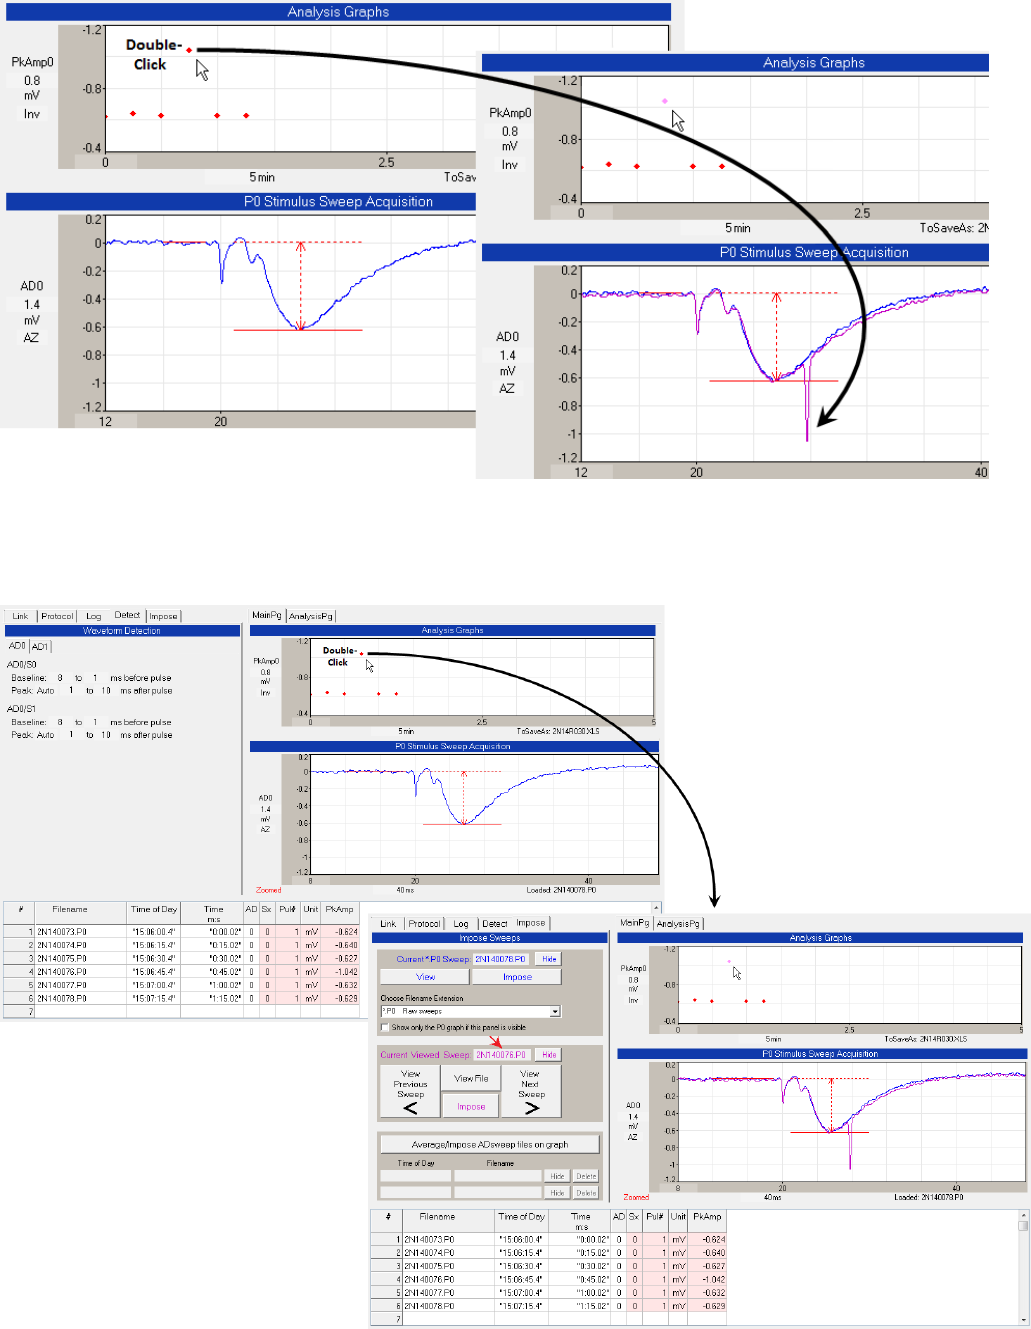
Fig.. 5.2.2. When an Analysis Graph data point is clicked to View a sweep, the entire ‘Impose’ tabsheet
appears (left side of lower right panel), and the filename of the ADsweep file of that Viewed sweep also
appears as the ‘Current Viewed Sweep’ (red arrow).