
User manual


137
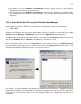
Most importantly, neighboring sweeps can be searched and examined by clicking on the ‘View Previous
Sweep’ and ‘View Next Sweep’ buttons (shown by red arrows in Fig. 5.1.3). For the Current Viewed
Sweep of ‘0003’ (with 40 msec pulse delay), clicking the ‘View Previous Sweep’ button then would show
the ‘0002’ sweep with 30 msec delay and then the ‘0001’ sweep with 20 msec delay (left black arrows in
Fig. 5.1.3). For the Current Viewed Sweep of ‘0003’ (with 40 msec pulse delay), clicking the ‘View Next
Sweep’ button then would show the ‘0004’ sweep with 50 msec delay and then the ‘0005’ sweep with 60
msec delay (right black arrows in Fig. 5.1.3).
Fig. 5.1.3. Shifting ‘up’ and ‘down’ to neighboring Viewed sweeps by clicking on the ‘View Previous
Sweep’ button and the ‘View Next Sweep’ button.
5.2 Viewing Sweeps by Clicking on an Analysis Graph Data Point
The simplest way of Viewing a single sweep is to click on an Analysis Graph data point that was
generated by that sweep, and that sweep be superimposed over the current normal trace. This is
particularly useful when wanting to view the sweep from an earlier part of the experiment, or a sweep that
generated an outlier data point. It is also a simple way of finding the filename of the ADsweep file that
generated a particular data point.
When the outlier data point in the PkAmp0 Analysis Graph in Fig. 5.2.1 was double-clicked with the left
mouse button, that sweep is superimposed in the lower right ADsweep graph (magenta colored trace).