
User manual


129
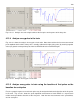
4.18 Getting a quick printout of your Analysis Graphs using a
PrintScreen program
The PrintSceen capability in Windows is rather crude. The whole screen must be printed, not just the
important section of it that you are interested in. However, certain PrintScreen programs such as the
Gadwin PrintScreen program (freely downloadable from www.gadwin.com) can make quick printing of
your Analysis Graphs extremely easy.
With Gadwin PrintScreen:
1) When the ‘PrtScn’ button is pressed, a cursor appears on the screen, and you manually select with
the mouse the subsection of the screen containing the Analysis Graphs you want to print. Press
enter to capture this screen subsection.
2) Then you can either:
a) direct the output to the Clipboard where you can then insert it into an imaging program like Paint
(a fairly laborious procedure), and/or you can
b) direct the output to a printer and immediately print out the Analysis Graphs screen subsection
(fast if you have an online or networked printer), and/or you can
c) direct it to an automatically named *.TIF file for later printing.
I think that Gadwin PrintScreen program is a brilliant piece of software that does the job brilliantly! You
can also support Gadwin Systems by purchasing a Professional version if you wish to further annotate
your printscreens.
4.19 Compress Data Files at the End of an Experiment?
There are no longer any strong reasons to zip data your data files at the end of an experiment. Although
in the old LTP Program it may have made sense to zip up your data, this was primarily because the many
ASCII ADsweep files saved in an experiment was an inefficient use of disk space – causing at least a 10-
fold decrease in saving efficiency.
However, with 1000GB hard disks and cheap 4.7 GB DVDs, there is no longer any reason to zip up your
ADsweep files.
Also, Windows 2000, XP, Vista, 7 and 8 can easily take at least 10,000 ADsweep files per folder without
any perceptible decrease in Read/Write speed.
WinLTP will now also directly reanalyze data directly from the read-only CDs and DVDs (while writing the
new *.AMP, *.XLS and reaveraged/filtered/blanked ADsweep files to the hard disk). If these CDs and
DVDs contained zipped files, they would first have to be copied to the hard disk, unzipped, and then
reanalyzed.
Also, WinLTP automatically creates a new data folder at the beginning of each experiment, and it is easy
to create additional directories 'on-the-fly' during the experiment. This makes data organization much
easier.