
User manual


120
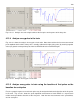
Fig. 4.13.3.1. Analysis of a train using baseline of the first pulse and response of the last pulse.
4.13.4 Analyze every pulse in the train
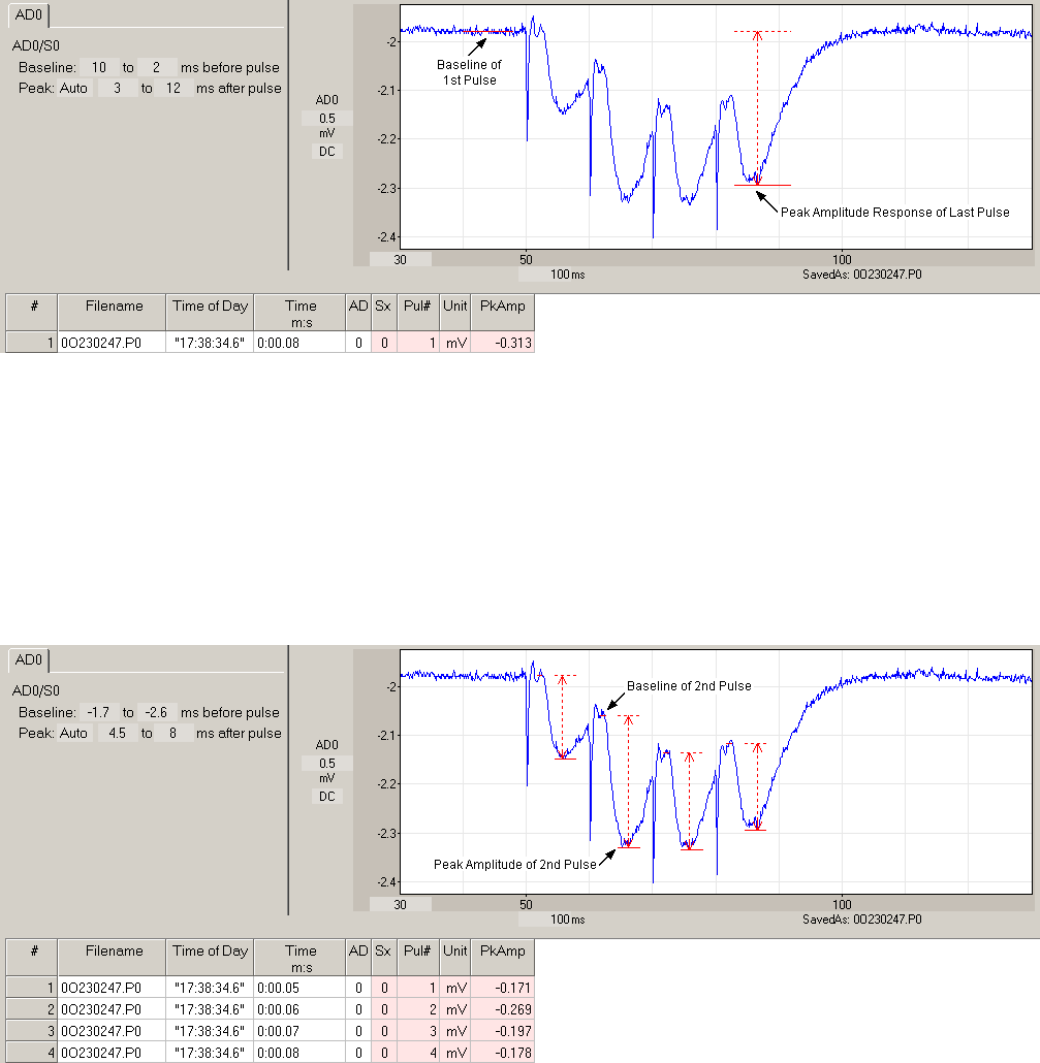
Fig. 4.13.4.1 shows the analysis of every pulse in the train. Note that to achieve the best measurement of
peak amplitude the baseline of the pulse is actually shifted to the right of the pulse (by entering negative
values) to get to the most positive part of the last EPSP before the next EPSP begins.
Fig. 4.13.4.1. Analysis of every pulse in the train.
4.13.5 Analyze every pulse in train using the baseline of first pulse as the
baseline for each pulse
First, the synaptic responses to each train pulse may be analyzed relative to the baseline of the first pulse
in the train. Fig. 4.13.5.1 shows the peak amplitude measurement of each fEPSP in a 4 pulse train
relative to the prestimulus baseline of the first pulse. Note the four measurements in the spreadsheet,
one for each pulse.