
User manual


11
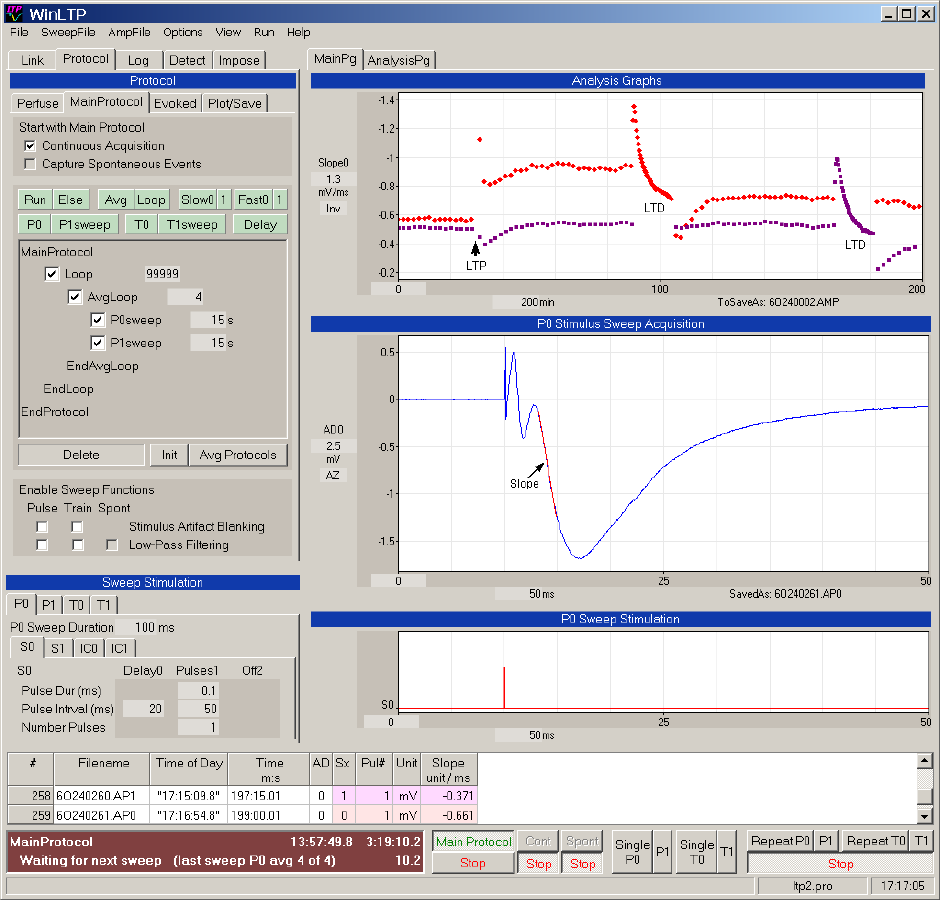
Fig. 1.3.1. WinLTP layout for a basic LTP/LTD experiment showing the Protocol fields (upper left panel),
analysis graphs (in this case only one slope graph, top right panel), Sweep Acquisition (middle right
panel), Sweep Stimulation fields and graphs (lower left and right panels), and the Spreadsheet and Run
Buttons (bottom panels). Detection fields to change synaptic potential detection values are hidden behind.
The MainProtocol panel shows the alternating P0sweep every 30 sec, then P1sweep every 30 sec, in
an AvgLoop of 4 to produce an average every 4 sweeps.
Pulse Sweep P0 stimulation producing only one S0 extracellular stimulation pulse (left lower panel and
the stimulation graph in the right lower panel). With this simple stimulation, rapid repeating of Pulse
Sweep P0 at 1/sec produces rapid 900 pulse LTD S0 stimulation at the same frequency.
The Sweep Acquisition graph shows a fEPSP evoked by S0 stimulation (10 ms after the start of the
sweep, averaged from 4 sweeps) with a red line showing the slope. The slope graph shows calculations
of slope for S0-evoked fEPSPs (red triangles) and S1-evoked fEPSPs (magenta squares) caused by
alternating S0/S1 pathway stimulation produced by alternating P0/P1 sweeps. Calculations are normally
made on 4 averaged sweeps, but 20 averaged sweeps are used during LTD stimulation. Numerical
values for slope (“Slope”) are also shown on the spreadsheet panel below the graphs.
In the spreadsheet, “Time of Day” shows the time the sweep began, “Time m:s” shows the time of the
stimulus pulse from when analysis starts, “Sx” shows whether S0 or S1 stimulation was used to evoke the
synaptic response, “Pul#” shows the number of the S0 or S1 pulse that evokes the synaptic response,
and “Slope” shows the calculated slope of the evoked response.