
User manual


117
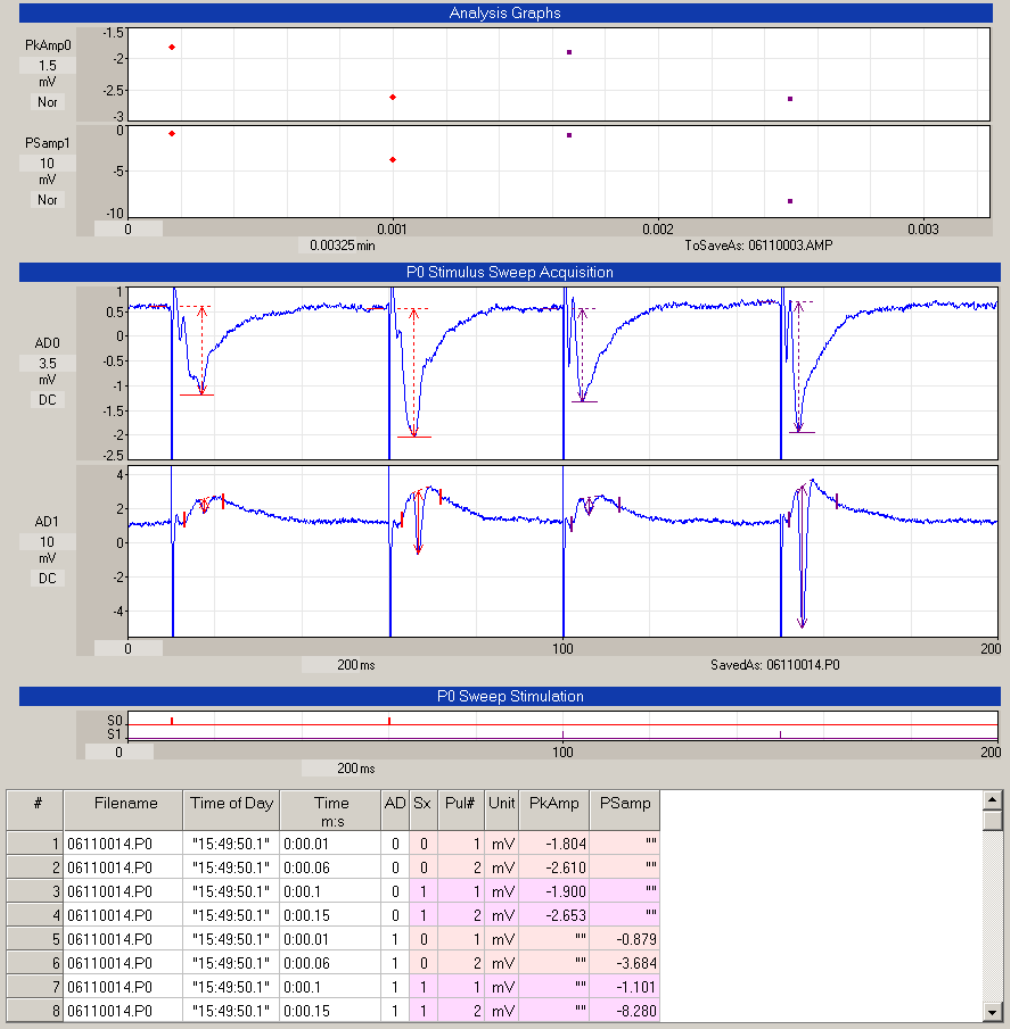
Fig. 4.12.1. Two channel acquisition and analysis all S0- and S1-evoked synaptic responses in both
acquisition channels. Analysis Graphs: Top two graphs show calculated values for the peak amplitude
of the synaptic responses in AD0 (PkAmp0), and the pop-spike amplitude from the responses in AD1
(PSamp1). P0 Stimulus Sweep Acquisition: The middle two graphs show channel AD0 (a recording of
fEPSPs from the CA1 dendritic layer), and channel AD1 (a recording of population spikes from the CA1
cell body layer). The peak and pop-spike amplitude calculations of paired S0-evoked synaptic responses
are shown in red, and of paired S1-evoked synaptic responses in magenta. P0 Sweep Stimulation: S0
paired-pulse stimulation (red top trace) and S1 paired-pulse stimulation (magenta bottom trace).
Spreadsheet: Showing analysis of EPSPs and PopSpikes from the analysis of the sweep above. The
‘Time m:s’ field shows the time of the stimulus pulse from when analysis starts (in this case simply the
beginning of this sweep). Channel AD0 is calculated first, S0-evoked EPSPs are calculated first, and
pulse number is calculated sequentially. When the PkAmp values (for AD1) or the PSamp values (for
AD0) are not calculated, they are set to “”. This Spreadsheet can then be saved to an *.AMP text file
and/or to an Excel *.XLS file.