
User manual


115
The cell input resistance Rm is calculated as:
Rm = V
Pulse
/ I
SteadyState
- Rs
where V
pulse
is the amplitude of the RsRm voltage clamp test pulse relative to basline of the preceding
epoch, I
SteadyState
is the amplitude of the current measured between the baseline and 70% and 90% of the
pulse when the current has reached steady state, and Rs is the patch electrode series resistance.
In WinLTP, Rs is almost always measured during patch clamp voltage clamping (assuming you click the
AnalysesToDo Rs check box), but is not measured during patch clamp current clamping, and therefore Rs
= 0 in this case, and Rm = V
Pulse
/ I
SteadyState
. Furthermore, during whole cell single electrode voltage
clamping, where series resistance is theoretically zero, you would not measure Rs and it would therefore
be set to Rs = 0, and Rm = V
Pulse
/ I
SteadyState
. For intracellular current clamping using a bridge circuit, Rs
would also not be measured and would therefore be set to Rs = 0, and Rm = V
Pulse
/ I
SteadyState
.
4.12 Analyzing All S0- and S1-Evoked Postsynaptic Responses in
Both AD channels in a Sweep
WinLTP is capable of acquiring data from 2 channels and analysing all S0- and S1 evoked synaptic
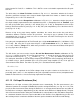
responses on both acquisition channels. Fig. 4.12.1 illustrates this with one acquisition channel
extracellularly recording the CA1 dendritic layer of the hippocampal slice, and the other acquisition
channel extracellularly recording the CA1 cell body layer (panels AD0 and AD1 respectively in Fig. 4.12.1,
middle traces).
The stimulation during the sweep consists of paired-pulse S0 stimulation (red trace) followed by paired-
pulse S1 stimulation (magenta trace) (Fig. 4.12.1, bottom traces).
Both S0 and S1 stimulations evoke fEPSPs in the CA1 dendritic layer (AD0) and fEPSPs with overriding
population spikes in the CA1 cell body layer (AD1). All S0-evoked synaptic responses are analysed and
shown by red lines in AD0 and AD1, and all S1-evoked synaptic responses are analysed and shown by
magenta lines (Fig. 4.12.1, middle traces).
The values of the peak amplitude calculations for AD0 are shown in PkAmp0 (red triangles for S0 evoked
responses, and magenta squares for S1-evoked responses; Fig. 4.12.1, top traces). The values of the
population spike amplitude calculations for AD1 are shown in PSamp1 (red triangles for S0 evoked
responses, and magenta squares for S1-evoked responses).
When the LTP Program performs an on- or off-line analysis of one or more acquisition sweeps, it puts the
results into the Spreadsheet (Fig. 4.12.1, bottom panel). “TimeOfDay” shows the time the sweep began.
“Time m:s” shows the time of the stimulus pulse from when analysis starts (in this case simply the
beginning of this sweep since this was the only sweep analyzed). “AD” shows the AD channel from
which the synaptic response was obtained (channel AD0 is calculated first). “Sx” shows whether S0 or
S1 stimulation was used to evoke the synaptic response (S0-evoked responses are calculated first).
“Pul#” shows the number of the S0 or S1 pulse that evokes the synaptic response (pulse number is
calculated sequentially). “PkAmp” shows peak amplitude values of the S0- and S1-evoked fEPSPs in
channel AD0. “PSamp” shows the population spike amplitude values of the S0- and S1-evoked