
User manual


114
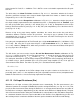
taken from the Rs Peak; Rs = ~29 Mohm. This is NOT the same as the double exponential fit at Rs peak
time in C.
The third choice, the Show Fit Values checkbox in Fig. 4.11.11.1, determines whether the fit values
(baseline, coefficients and taus) of the single or double exponential fit are shown, as shown in the upper
left part of Fig. 4.11.11.4B. The default is off.
The fourth choice, from the Extrapolation radiobuttons in Fig. 4.11.11.1, determines whether the peak of
the single or double exponential fit to the capacitative transient: 1) Extrapolates back to TimeZero, eg to
the start of the RsRm pulse (and this is the default) (Fig. 4.11.11.4A), 2) Extrapolates back to a time
between TimeZero and the Rs peak (Fig. 4.11.11.4B), and 3) No extrapolation, just use the time to the Rs
peak (Fig. 4.11.11.4C).
Because of lag in the patch clamp amplifier stimulation, the correct time to take the peak will be
somewhere between TimeZero and the Rs peak time. One way to get an estimate of the correct
extrapolation time is to take a model cell, and see how much shift from TimeZero gives the best Rs
measurement for the model cell.
Using the peak extrapolated back to TimeZero will give a slight underestimate of Rs (~25 Mohms in Fig
4.11.11.4A). But using the Rs peak time will give a slight overestimate of Rs (~31 Mohms in Fig
4.11.11.4C). However, changes in Rs, which many researchers are most concerned about, will be picked
up using any of these Rs analyses.
The fifth choice you have to make, from the Rs and Rm Measurement Results radiobuttons in Fig.
4.11.11.1, is whether to get the Rs and Rm measurements: 1) directly in pA or mV (from you have to
convert to resistance by Rs = V
Pulse
/ I
Peak
and Rm = (V
Pulse
/ I
SteadyState
) – Rs), 2) in Mohms using the IC0 or
IC1 analog out stimulation (in mV for voltage-clamping and nA or pA for current clamping) (the default), or
3) in Mohm using a gated stimulation pulse set on the patch clamp amplifier (in mV, nA or pA) and
entered into the fields below. For choices 2) and 3), Rs is calculated from the equation:
Rs = V
Pulse
/ I
Peak
where V
pulse
is the amplitude of the RsRm voltage clamp test pulse relative to the baseline of the
preceding epoch, and I
Peak
is the amplitude of the peak capacitative transient current (extrapolated back
toward the start of the V
Pulse
if measured using exponential curve fitting).
4.11.12 Cell Input Resistance (Rm)
Membrane or cell input resistance (Rm) detection occurs automatically. The Rm measurement is the
difference between the averaged PreRmBaseline and the averaged RmPulse (see Fig. 4.11.11.2). That
part of the Rm measurement taken during the RmPulse is an average taken between 80% and 100% of
the RmPulse if no low-pass digital filtering (or 70% and 90% of the RmPulse if digitally filtered). That part
of the Rm measurement taken during the PreRmBaseline is taken between 10% and 100% of that period,
or a maximum duration of the time equal to 80-100% of the RmPulse if no digital filtering (or 10% and
90% of that period, or a maximum duration of the time equal to 70-90% of the RmPulse with filtering).