
User manual


108
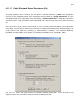
Fig. 4.11.9.1. Detection of Population Spike Amplitude and Population Spike Latency. Detection occurs
between the left and right brackets on the waveform. The solid vertical line is the PopSpike Amplitude,
and the time between the stimulus pulse and the solid vertical line is the PopSpike Latency.
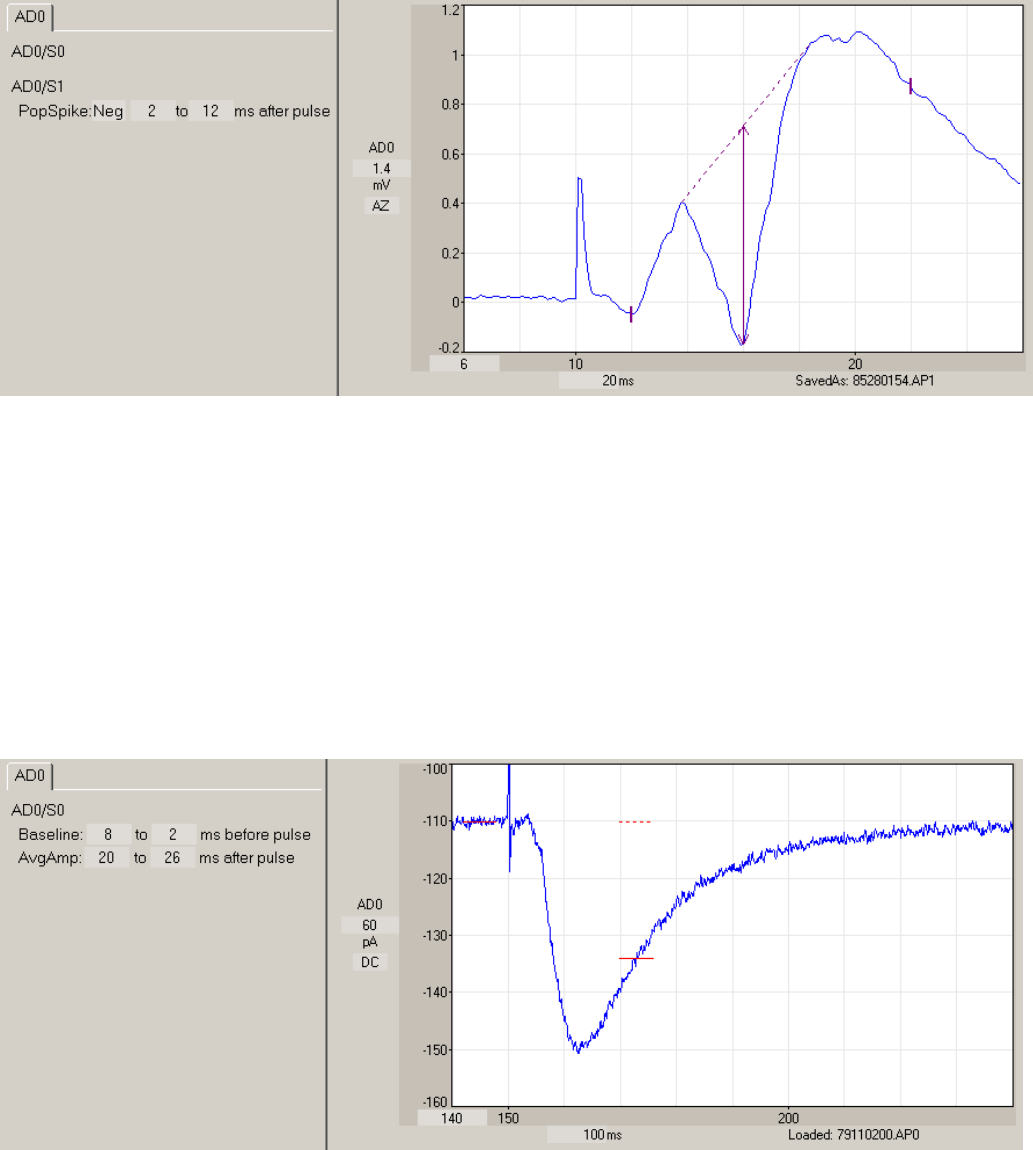
4.11.10 Average Amplitude
The Average Amplitude is the difference between the DC Baseline value and the averaged values
between the
AvgAmp : ___ to ___ ms after pulse
time fields and is shown in the AvgAmp solid line of the Pulse Detection Panel (see Fig. 4.11.10.1).
Fig. 4.11.10.1. Detection of Average Amplitude between 23 and 27 ms after the stimulus pulse (solid line)
relative to the pre-pulse baseline (dotted line).