
User manual


106
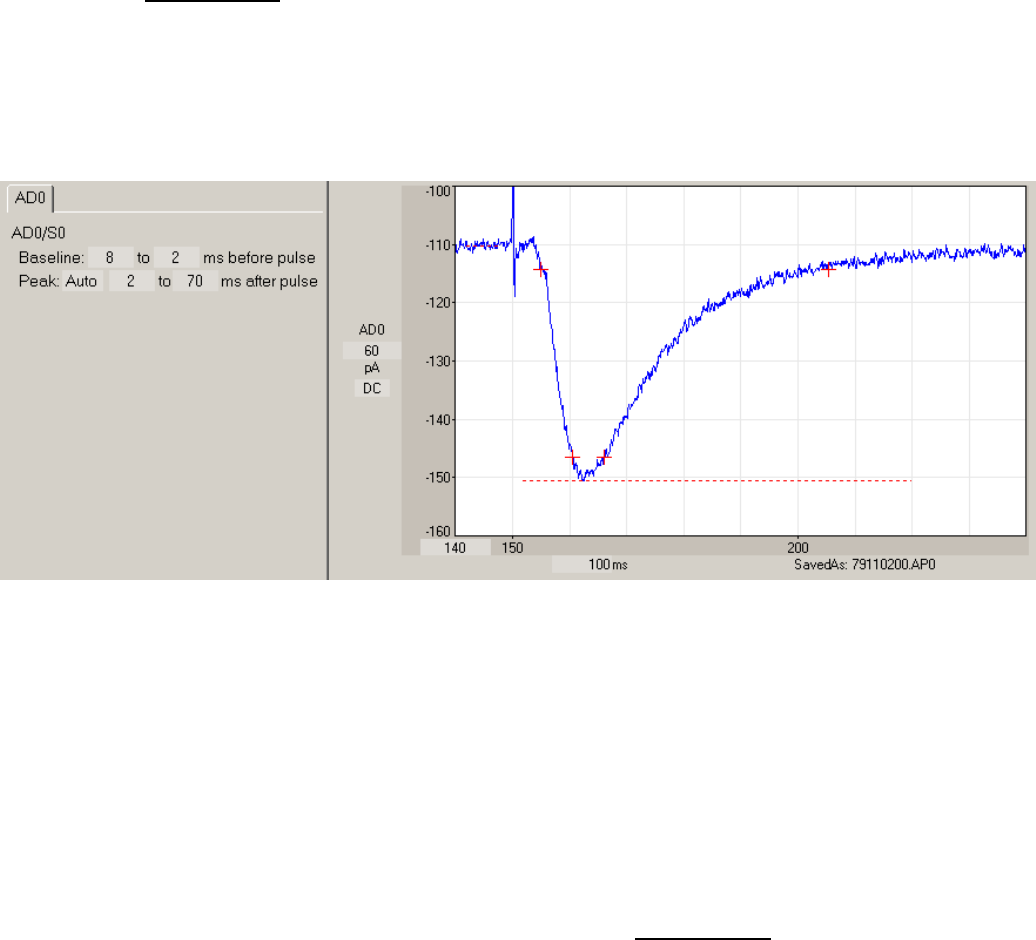
4.11.7 Rise Time and Decay Time
Rise Time calculates the time between 10% and 90% of DC baseline to peak on the rising phase of the
peak and is shown by + ‘s. Decay Time calculates the time between 10% and 90% of DC baseline to
peak for the falling phase of the peak and is also shown by + ‘s. Therefore the Rise Time and Decay Time
depend on DC baseline settings. The Rise Time and Decay Time is measured between the
Peak: Auto/Pos/Neg ___ to ___ ms after pulse
time fields shown by the dotted horizontal peak line in the Pulse Detection Panel in Fig. 4.11.7.1. Just as
with the Peak Amplitude measurement, the Auto/Pos/Neg field determines whether the peak will be
Automatically (Auto) determined to be positive or negative, forced to be Positive (Pos), or forced to be
Negative (Neg).
Fig. 4.11.7.1. Detection of 10-90% Rise Time and 10-90% Decay Time. The 10% and 90% Rise Times
are denoted by the first and second + ‘s. The 10% and 90% Decay Times are denoted by the third and
fourth + ‘s. The range for detecting the Rise and Decay Times (shown by the dotted line) was set to 2 to
70 ms after the stimulus pulse.
4.11.8 Coastline
Coastline calculates the amount of vertical deflection between the
CoastLn: ___ to ___ ms after pulse
time fields and is shown to occur between the left and right brackets on the waveform (Fig. 4.11.8.1).
(Alternatively, if Peak Amplitude is also being calculated, Peak: Auto/Pos/Neg ___to ___ms after pulse
indicates the time fields). The Coastline is measured in mV or pA. Coastline does not depend upon DC
baseline.
For example, the coastline of an EPSP of 1 mV amplitude would be 2mV. Coastline is indicative of, and
sensitive to, the addition of extra population spikes in an epileptiform burst and can therefore be useful in
epilepsy studies.