
User manual


100
The top line in the dialog box shows whether the Analysis To Do will be performed on channel AD0 and
/or AD1 (only AD0 in this example). The next line shows where these calculations will be plotted or
displayed, either on the MainPg or the AnalysisPg. More than four MainPg calculations checked will not
be accepted. More than eight AnalysisPg calculations checked will not be accepted. If an Analysis To
Do is chosen, say Slope, then Slope will also appear as one of the columns in the spreadsheet, and will
also be saved to the Amplitude analysis (*.Amp) file. WinLTP can analyze all S0- and S1-evoked synaptic
responses in all channels in both Pulse and Train sweeps (see Section 4.12).
Adding the four Analysis Graphs on the MainPg with the eight Analysis Graphs on the Analysis Page
gives a total of twelve Analysis Graphs that can be viewed during online acquisition and reanalysis.
4.11 Setting the Calculation Detection Criteria
The fields that set the ranges for detecting the various calculations are set in the Pulse Waveform
Detection Panel (Fig. 3.1.2.3). However, only if at least one of the MainPg or AnalysisPg check boxes is
chosen for a particular waveform calculation row in the Amp/Slope Analyses To Do dialog box (Fig.
4.10.1) will the particular calculation be plotted and saved to the Amplitude/Calculation file as a non-zero
value.
4.11.1 DC Baseline
If DC Baseline, Peak Amplitude, Peak Latency, Area, Duration, Rise Time, Decay Time, Average
Amplitude, or Slope (for Low% -> High% Peak Amplitude) is chosen, then the DC Baseline value will be
calculated.
The
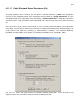
BaselineS0: __ to __ ms before pulse
time fields shown in the Pulse Detection Panel in Fig. 4.11.2.1 set the pre-stimulus pulse baseline to be
between these two ‘Baseline’ time values, and both are relative to the stimulus pulse.
4.11.2 Peak Amplitude
The Peak Amplitude is the difference between the DC Baseline value and the calculated peak. The peak
will be measured between the time fields in
Peak: Auto/Pos/Neg ___ to ___ ms after pulse
and is shown by the PkAmp solid line of the Pulse Detection Panel in Fig. 4.11.2.1. The first ‘Peak’ time
value must be before the Peak Amplitude, and the second ‘Peak’ time value must be after the Peak
Amplitude, and both are relative to the stimulus pulse.