
User manual
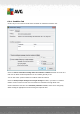


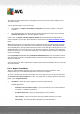
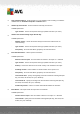

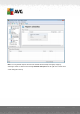


Table Of Contents
- Introduction
- AVG Internet Security Business Edition Installation
- AVG Admin Deployment Wizard
- AVG Network Installer Wizard Basic Mode
- AVG Network Installer Wizard Advanced Mode
- AVG Admin Console
- AVG Admin Server
- AVG Admin Lite
- AVG Settings Manager
- Configuration
- How to...
- How to Connect Stations to AVG Datacenter
- How to Migrate Stations from/to Different DataCenter
- How to Synchronize Stations
- How to solve Update related issues
- How to Change User Interface Language
- How to use Microsoft SQL Server database system
- How to Control station users actions
- Requests handling and status messages
- How to manage access rights
- How to maintain the DataCenter database
- List of AVG Setup Parameters
- AVG DataCenter
- Updates
- AVG Admin Server 2012 for Linux
- FAQ and Technical Support

A V G Internet Security Business Edition 2012 © 2012 C opyright A V G Tec hnologies C Z, s.r.o. A ll rights reserved. 12 6
- Type of Chart - choose the requested chart type (default selection is pie chart).
- Grouped by - the result data will be grouped by the selected column.
- Severity - choose the minimum scan results severity to be included in the report.
- Including rootkits - choose whether to include rootkits to the report or not.
Virus scan report - This report shows the status of viruses.
Available parameter:
- Time interval - specify the time interval for selecting data (last day, last week, last
month, last year, unlimited).
- Severity - choose the minimum scan results severity to be included in the report.
- Including rootkits - choose whether to include rootkits to the report or not.
Viruses on stations - This report shows the viruses on stations.
Available parameters:
- Time interval - specify the time interval for selecting data (last day, last week, last
month, last year, unlimited).
- Severity - choose the minimum scan results severity to be included in the report.
- Including rootkits - choose whether to include rootkits to the report or not.
- Grouped by - the result data will be grouped by the selected column.
6.9.2. Report Schedules
In this group, you can create, edit and view graphic report schedules. Actions applicable on
individual or multiple reports are available through the right-click context menu:
Edit - opens an edit dialog for the selected schedule.
Define a new schedule - will start the wizard for creating a new report schedule.
The Report Schedule is active - use this function to activate or disable selected report(s).
Remove - removes selected reports from AVG DataCenter.
By default, there are no schedules available. To prepare a new scheduled report, right-click in the
Report schedules area and select the Define a new schedule item from the menu.