
User manual
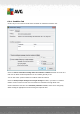


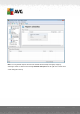


Table Of Contents
- Introduction
- AVG Internet Security Business Edition Installation
- AVG Admin Deployment Wizard
- AVG Network Installer Wizard Basic Mode
- AVG Network Installer Wizard Advanced Mode
- AVG Admin Console
- AVG Admin Server
- AVG Admin Lite
- AVG Settings Manager
- Configuration
- How to...
- How to Connect Stations to AVG Datacenter
- How to Migrate Stations from/to Different DataCenter
- How to Synchronize Stations
- How to solve Update related issues
- How to Change User Interface Language
- How to use Microsoft SQL Server database system
- How to Control station users actions
- Requests handling and status messages
- How to manage access rights
- How to maintain the DataCenter database
- List of AVG Setup Parameters
- AVG DataCenter
- Updates
- AVG Admin Server 2012 for Linux
- FAQ and Technical Support

A V G Internet Security Business Edition 2012 © 2012 C opyright A V G Tec hnologies C Z, s.r.o. A ll rights reserved. 12 5
Non-compliant stations - shows stations in a non-compliant state according to conditions
available from the View/Non-compliance conditions menu.
Stations by AVG Version - shows all stations sorted by AVG version.
Available parameters:
- Type of Chart - choose the requested chart type (default selection is pie chart).
Stations not communicating longer than N days
Available parameters:
- Number of days - choose the number of days for which the stations were not
communicating.
- Type of Chart - choose the requested chart type (default selection is pie chart).
- Grouped by - the result data will be grouped by the selected column.
Most infected stations - shows top infected stations.
Available parameters:
- Stations count in report - limit the number of stations in the report. 0 = unlimited.
- Type of Chart - choose the requested chart type (default selection is pie chart).
- Severity - choose the minimum scan results severity to be included in the report.
- Including rootkits - choose whether to include rootkits to the report or not.
- Grouped by - the result data will be grouped by the selected column.
- Time interval from - specify the beginning of the time interval for selecting data (last
day, last week, last month, last year, unlimited).
- Time interval to - specify the ending of the time interval for selecting data (last day,
last week, last month, last year, unlimited).
- Include only threats - choose to include confirmed/unconfirmed or all threats.
Most threats - This report shows the top threats of all stations.
Available parameters:
- Viruses count in report - limit the number of viruses in the report. 0 = unlimited.
- Time interval - specify the time interval for selecting data (last day, last week, last
month, last year, unlimited).