
User's Manual

System synchronization analysis 227
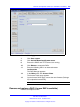
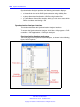
• The Tree view pane shows a hierarchical view of the synchronization
tree. In the tree view, you can select a DAP.
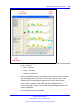
• The Visibility Information pane shows an overview of the RSSI values.
—
The RSSI (sees) column indicates the signal strength with which
the selected DAP communicates with the other DAPs.
— The RSSI (seen) column indicates the signal strength with which
the other DAPs communicates with the selected DAP.
Although the radio signal connection is reciprocal, differences can exist
between the seen and sees RSSI value.
The RSSI values are hexadecimal in the range: 0 to e; 0 indicates no
signal. The --80 dBm boundary is found at the boundary between 3
and 4. Generally, the Phase difference must be ffffffff with a maximum
deviation of 7
• The Building Information pane shows overall data related to the DECT
cluster.
•
The DAP Information pane shows data of the selected DAP.
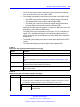
Table 37
Buttons on the Synchronization Analyzer main page
Button Function
Load Location Click Load Location to open a specific Location file.
View Location Click View Location to open the Location page without specifying a Location
file.
For more information, see “Synchronization Analyzer Location page” (page
228).
Settings Click Settings to open the Settings page, on which you can enter the RSSI
threshold and the Phase Difference threshold.
Find Click the Find button to search the RPN number, the MAC address, or Info
field of all the DAPs.
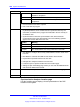
Table 38
Menus on the Synchronization Analyzer main page
Menu
Contains these options
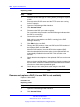
File
• Open to open a Visibility File.
• Compare to open a Visibility file and compare it with the current tree. One of
the following symbols appears next to each DAP in the tree view.
Symbol
Meaning
+ Red The current level of an RPN is higher that the one in the
compared file.
Nortel Communication Server 1000
SIP DECT Fundamentals
NN43120-123 02.02 30 March 2010
Copyright © 2008-2010 Nortel Networks. All Rights Reserved.
.