
User's Manual


Correct audio quality problems 71
and P16" (page 48). Critical points P11, P13 and P16 form the
following.
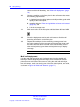
• contours in Figure 24 "Contours formed by critical points P11,
P13, and P16" (page 47)
•
the cell center 1C5 in Figure 25 "Cell center 1C5 formed by
critical points P11, P13, and P16" (page 48)
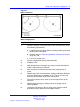
•
a new cell boundary in Figure 26 "Cell boundary 1C5 formed
by critical points P11, P13, and P16" (page 48)
For more information, see Figure 27 "Example of critical point
cell boundaries" (page 49) and Figure 28 "Example of cell center
boundary 1C6" (page 49).
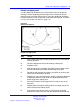
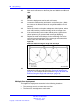
Critical points P11, P12, and P17 form the following.
• contours in Figure 27 "Example of critical point cell
boundaries" (page 49)
• a new boundary based on cell center 1C6 in Figure 28
"Example of cell center boundary 1C6" (page 49)
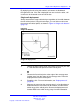
Figure 24 "Contours formed by critical points P11, P13, and P16"
(page 47) shows a floor plan with complete radio coverage. The
floor plan is made complete by cell boundary 1C7.
--End--
Correct audio quality problems
If a user office is near the critical point and the audio quality deteriorates
within the user office, the deployment tool and the cell center are not
properly located.
Procedure 13
Correcting problems with audio quality
Step Action
1 Move the cell center closer to the office or work area in question.
2 Repeat the coverage test in that area and ensure that coverage
is sufficient.
This can impact the coverage at other points, and you must
ensure that all critical points are still properly covered by the new
location.
3 Go into every location where users make and receive calls.
Nortel Communication Server 1000
SIP DECT Fundamentals
NN43120-123 01.07
6 January 2009
Copyright © 2008-2009 Nortel Networks
.