
User's Manual
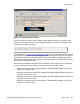
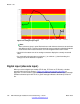
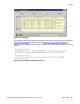
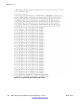
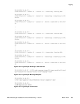

Figure 131: eIO analogue input modules
For each module, the URL is shown, and the module identifier. When you hold the mouse
pointer over the status area of a contact, detailed information is shown. An example of the
information provided is as follows:
Min (set: 02,000000 - reset: 08,000000)
Max (reset: 14,000000 - set: 20,000000)
The chart shown in Figure 132: Analogue input ranges on page 184 explains the behavior of
these settings. The chart shows the voltage levels between 0 and 24 V on the Y-axis, and the
time between 12:00 and 12:45 on the X-axis. There are four different configuration values,
which are indicated in yellow. These values are retrieved from the eIO_AI table and match the
environment in FieldPoint Explorer.
On the chart, the analogue measured values are shown in black. The green area is the idle
zone, the red areas are alarm zones, and the grey areas are transition zones.
• When the measured value reaches 20,00000 V, a MAX ALARM condition is set. This is
shown in the chart on 12:07.
• When the measured value drops to 14,00000 B, the MAX ALARM condition is reset. This
is shown in the chart on 12:27.
• When the measured value drops to 02,00000 B, the MIN ALARM condition is reset. This
is shown in the chart on 12:37.
• When the measured value reaches 08,00000 V, a MIN ALARM condition is set. This is
shown in the chart on 12:45.
Analogue input
DECT Messenger Installation and Commissioning — Book 1 March 2012 183