
2017
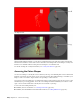
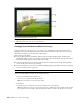
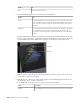
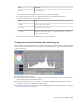
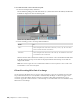
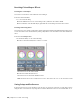
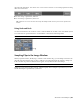
Table Of Contents
- Contents
- What's New
- Getting Started with Smoke
- Smoke Interface Overview
- Managing Projects and Users
- Organizing Media in the Workspace
- Importing and Exporting Media
- Importing File-Based Media
- Exporting Clips and Sequences to Files
- Supported File Formats
- Importing an EDL Sequence
- Importing an AAF Sequence
- Importing a Final Cut Pro XML Sequence
- MediaHub Reference: Browsing for Files
- Customizing your File Imports Options
- Applying a LUT or Colour Transform on Import
- ARRIRAW Format Settings - Import
- Audio File Settings - Import
- AVCHD Format Settings - Import
- Canon Format Settings - Import
- DPX Format Settings - Import
- HDR Format Settings - Import
- Image Sequence Settings - Import
- MP4 Format Settings - Import
- MXF Format Settings - Import
- Open Clip Format Settings - Import
- OpenEXR Format Settings - Import
- Panasonic Format Settings - Import
- Photoshop Format Settings - Import
- PNG Format Settings - Import
- QuickTime Format Settings - Import
- R3D Format Settings - Import
- Sony Format Settings - Import
- SonyRAW Format Settings - Import
- SonySStP Format Settings - Import
- XDCAM EX Format Settings - Import
- About Pixel Aspect Ratio
- About Video Field Management
- Working with Others
- Using Subtitles Files
- Python Hooks Reference
- Conform Overview
- Clip Input/Output Using a VTR
- Configuring Hardware For Clip Input and Output Using a VTR
- Configuring Software For Clip Input and Output Using a VTR
- Inputting Clips From a VTR
- Outputting Clips To a VTR
- Monitoring Video During Clip Output
- Setting Input and Output In and Out Points
- Inputting and Outputting a Live Video Signal
- Generating Proxies from VTR Input
- Capturing Material with Variable Frame Rate
- Controlling a VTR
- Audio Gain Adjustment Settings
- Setting Video Input and Output Engineering Menu Controls
- Inputting and Outputting with Headroom
- Capturing 60i Material with 2:3 Pulldown Removal
- Configuring Dual-Serial Link I/O
- VTR I/O Supported Timings
- Archiving in Smoke
- Archiving a Project to a File-based Archive
- Restoring a Project from a File-based Archive
- Archiving Clips to a File-based Archive
- Restoring Material from a File-based Archive
- Tips for Using Archives
- Managing the Size of an Archive
- Supplementing Archives with System Drive Backups
- Restoring Legacy Archives
- Deleting Content from an Archive
- MediaHub Reference: Browsing for Archives
- Playing Back Media
- Playback
- Playing Back Clips in the Full Screen Player
- Jogging and Panning a Clip
- Switching the Playback Focus between the Source and Sequence Clips
- Comparing Three Shots in the Triptych Player
- Play Back Speed Indicators
- Comparing Tracks in Split Screen
- Creating a Subclip in the Player
- Accessing Clip Information
- Player options
- Cue Marks
- Playback Options
- Setting up the Image Display Viewer in the Tools
- Setting up the Image Display Viewer in the Player
- Viewing Image Overlays in Batch
- Viewing Image Overlays in the Player
- Modifying Exposure and Contrast in the Image Display
- Enabling Aspect Ratio Display in the Player
- Changing Playback Scan Mode Options in the Player
- Displaying a Clip in the Broadcast Monitor
- Configuring a Dual Monitor Setup
- Playing Back with Proxies
- Color and Light Levels
- Changing Playback Scan Mode Options
- Enabling the Aspect Ratio Display
- Setting up the Image Display Viewer in the Tools
- Monitoring Dual Timecodes and Pulldown
- Displaying the Reference Area
- Displaying Multiple Views
- Playback
- Editing Clips and Sequences
- Inserting a Clip on the Timeline
- Overwriting a Clip on the Timeline
- Replacing a Clip on the Timeline
- Other Editing Operations
- Timeline Editing Settings
- Trimming Clips
- About Timeline Tracks and Versions
- About Timeline Patching
- Navigating and Searching the Timeline
- Using Markers on the Timeline
- About Timeline Containers
- About Timeline Gaps
- Playing the Timeline
- Cutting Clips on the Timeline
- Swapping Timeline Elements
- Removing Elements From the Timeline
- Matching Clips with Their Sources
- Grouping and Syncing Elements on the Timeline
- Timeline Reference
- Audio
- Accessing the Audio Desk
- Importing Audio Files
- Monitoring Audio in ConnectFX
- Adding an Audio Effect on a Segment
- Adjusting the Audio Levels on Part of an Audio Segment
- Cross-fading Two Audio Segments Together
- Fading Audio Into or Out of a Clip
- Scaling the Size of the Waveform
- Displaying Audio Waveforms
- Muting Audio Tracks
- Mapping Audio Tracks to Audio Desk Input Strips
- Converting Audio from Stereo to Mono or Mono to Stereo
- Rendering
- Timeline FX and Transitions
- Working with Timeline FX
- Working with Timeline Transitions
- Working with Timeline FX and Transition Presets
- Navigating Timeline FX and Transitions
- Adding Timeline FX to Gaps
- Working With Clip Format and Import Options on the Timeline
- 2D Compositing on the Timeline
- Adding Matte Containers
- Working with Mattes and Masks on the Timeline
- Compositing in 3D Space on the Timeline Using Action
- Keying on the Timeline
- Creating New Sources Using Tools from the Tools Tab
- Procedural Compositing with ConnectFX
- Creating ConnectFX
- About the ConnectFX Process Tree
- Adding and Connecting Nodes to the Process Tree
- Working with Clips in the Process Tree
- Adding Media to an Action Node
- Viewing Nodes in Context
- About CFX Output Nodes
- Saving and Loading ConnectFX Setups
- Using a Create CFX Clip for Caching or Versioning
- Using the Timing View to Offset Clips
- Caching Frames
- Grouping Nodes
- Mimicking, Copying, and Duplicating Nodes
- Customizing the ConnectFX Tools Bin
- Creating Custom Nodes
- ConnectFX Preferences
- Compositing in 3D Space with Action
- About Action
- Action Media
- Action Axes
- Action Surfaces
- Stereoscopic Workflow in Action
- Action Perspective Grid
- Action Lights and Lighting Effects
- Action 3D Geometry
- Action 3D Text
- Action Shading and Textures
- Action 3D Paths
- Action Cameras
- Action 3D Cameras
- Action Analyzer
- Action Source Nodes
- Chroma Keying and Working with Green Screens
- Setting Up the Nodes and Media to Pull a Key
- Setting Up Viewports for Keying
- Using Blend Nodes
- Creating and Refining a Key in the Master Keyer
- Creating a Key by Extracting a Single Colour with the Channel Keyer
- Creating a Key by Extracting a Range of Colours with the HLS, YUV, RGB and RGBCMYL Keyers
- Creating a Key by Setting the Luminance
- Refining Your Key
- Resetting Your Key
- Rendering Your Key
- Stabilizing and Tracking
- Accessing the Stabilizer
- How the Stabilizer Works
- Working with Trackers
- Selecting a Stabilizer Method
- Smoothing Out Camera Motion
- One-Point and Two-Point Axis Tracking
- Bilinear Surface Tracking
- Offsetting the Tracking Motion of the Reference
- Adjusting the Surface With the User Shape Channel
- Tracking Difficult Shots and Correcting Errors
- Adjusting the Size of the Tracker Box
- Positioning the Tracker Box Manually During Analysis
- Locking Keyframes in Place
- Changing the Reference Point
- Finding the Best Tolerance Value
- Analyzing Backward
- Manually Tracking a Pattern that Disappears
- Analyzing One Frame at a Time
- Editing the Stabilizer Channels on the Image
- Tracking a Degraded Copy of the Clip
- Changing the Colour of Trackers
- Pretracking a Clip
- Copying Shift Channels
- Importing and Exporting Data
- Masking and Rotoscoping
- GMask
- Accessing the Garbage Mask Menu
- About Garbage Mask Options
- Setting Mask Options
- About Drawing Options
- Drawing a Mask
- Adjusting the Number of Points in Freehand Segments
- Garbage Mask Nodes
- Changing the Priority Order of Masks
- Transforming the Mask
- Manipulating Vertices and Tangents
- Animating Garbage Masks
- Applying Motion Blur to Garbage Masks
- Blurring a Stationary Garbage Mask
- Rendering Garbage Masks in Interlaced Mode
- Using Multiple Garbage Masks
- Refining the Mask
- Using Region of Interest and the Tracer
- Saving Garbage Mask Setups
- Loading Garbage Mask Setups
- Preset Garbage Mask Setups
- Importing and Exporting Raw Setup Files
- Creating Customized Wipes with Garbage Masks
- GMask
- Colour Correcting
- About Colour Correcting
- About the Colour Warper
- Accessing the Colour Warper
- Setting Up Your Work Environment
- Sampling Clips in the Image Window
- Selecting Colour Ranges for Colour Correction
- Correcting Colour Imbalances
- Improving Contrast
- Matching Colours in Clips
- Performing Hue Shifts
- Creating Colour Casts
- Readjusting Colour After a Colour Correction
- Removing Colour Spill
- Creating Subsetups
- Painting
- Paint Node
- Accessing the Paint Node
- Using Sources
- Brush Attributes and Attribute Modes
- Painting Brush Strokes
- Using Paint Modes
- Revealing Sources
- Drawing Shapes
- Drawing Selections
- Copying, Pasting, and Deleting Shapes, Selections, and Strokes
- Clear shapes strokes and selections from a layer
- Erasing Shapes and Strokes
- Using Blending Modes
- Using the Canvas
- Previewing a Reveal Operation Using a Reference Image
- Saving Setups and Preferences
- Paint Node Keyboard Shortcuts
- Paint Tool
- Loading Clips into Paint
- Locking and Unlocking the Duration of a Clip
- Using the Mouse
- Displaying a Reference Image
- Using Overlays
- Selecting Colours
- Previewing an Animation
- Painting on Full-Resolution Film Images
- Saving and Restoring the Image
- About Canvas Mode
- About Brush Attributes and Modes
- Applying Filters
- Using Special Effects Media
- Wiping an Image
- Filling an Image
- Using AutoPaint
- About Mattes
- Using Graphics in Paint
- Accessing the Graphics Menu
- Creating Graphics
- Using the Object Tools
- Selecting Objects
- Editing Objects
- Setting the Object Resolution and Display
- Setting the Object Attribute
- Changing the Object's Appearance
- Changing the Size or Position of an Object
- Changing the Shape of an Object
- Converting Graphics to AutoPaint Strokes
- Animating Graphics
- Saving and Restoring Objects
- Tacking Down Objects
- Cutting and Pasting in Paint
- About Paint Setups
- Paint Node
- Text and Titling
- Using Shaders to Create Your Own Effects
- Effects and Tools Reference
- 2D Histogram
- 2D Transform
- Auto Matte
- Auto Stabilize
- Average
- Blend and Comp
- Blur
- Bump Displace
- Burn-in Letterbox
- Burn-in Metadata
- Clamp
- Colour Corrector
- Colour Curves
- Color Warper
- Colour Source
- Combine
- Comp
- Compound
- Damage
- Deal
- Deform
- Degrain
- Deinterlace
- Denoise
- Depth of Field
- Difference Matte
- Edge Detect
- Field Merge
- Filter
- Flip
- Garbage Mask
- Glow
- Gradient
- Interlace
- Keyer Channel
- Keyer HLS
- Keyer Luma
- Keyer RGB
- Keyer RGBCMYL
- Keyer YUV
- LUT Editor
- Map Convert
- Master Keyer
- Matte Curves
- Matte Edge
- Mono
- Motif
- Motion Analysis
- Motion Blur
- MUX
- Optics
- Paint Node
- Pixel Spread
- Proxy Extract
- Proxy Regeneration
- Pulldown
- Recursive Ops
- Regrain
- Resize
- Sparks
- Stabilizer
- Stereo Filter
- Stereo Toolbox
- Stylize
- Text
- Timewarp
- Animating Keyframes
- Keyframe Indicator Reference
- Animating Keyframes in the Animation Channel Editor
- Panning and Zooming in the Animation Channel Editor
- Adding Keyframes to Channels in the Animation Channel Editor
- Changing Keyframe Values in the Animation Channel Editor
- Copying and Pasting Channels or Keyframes in the Animation Channel Editor
- Changing the Duration of an Animation in the Animation Channel Editor
- Changing the Values of Keyframes Proportionally in the Animation Channel Editor
- Offsetting Select Keyframes or Channels in the Animation Channel Editor
- Simplifying the Number of Keyframes in the Animation Channel Editor
- Baking Keyframes
- Swapping Animation Curves
- Flipping Channels and Keyframes
- Removing Jitter from an Animation Curve
- Applying an Average
- Modifying Tangents to Reshape the Animation Curve
- Setting Display Preferences in the Animation Channel Editor
- Using Selection Sets to Control the Channels and Folders You Want to Display
- Generating Keyframes Based on Audio Analysis
- Animation Menu Settings
- Advanced Animation: About Expressions
- Colour Management
- Colour Management Workflow
- Applying Colour Management to Clips
- Applying Colour Management to Displayed Images
- Configuring Smoke to Use LUTs and Colour Transforms for Display
- Configuring the Colour Transform Aliases
- Applying 1D LUTs to the Monitor
- Applying 3D LUTs and Colour Transforms to Viewports
- Applying a 3D LUT or Colour Transform to the Projector or Broadcast Monitor
- Modifying Exposure and Contrast with Display Transforms
- Controlling the Look in Viewports
- Colour Management Files and Locations
- Autodesk Color Management
- About Autodesk Color Management
- Color Management Concepts
- Common Color Management Scenarios
- Color Managing Images on Input
- Color Managing Images for Display
- Color Managing Images for Output
- Color Managing Images from Scanned Film
- Color Managing Digital Cinema Camera Footage
- Color Managing Video Footage
- Color Managing Rendered 3D CG Images
- Color Managing Matte Paintings
- Color Managing Textures and Maps
- Color Management and Image-based Lighting (IBL)
- White Point Conversion
- Using Diagnostic Color Transforms
- Converting Images Between 12i or 16i and 16f Encodings
- Custom Color Transforms
- A Complex Color Management Example
- Color Transform Files
- Autodesk CTF File Format Version 1.3
- SynColor Configuration File
- Artist Control Surfaces
- Smoke Keyboard Shortcuts
- Setting Smoke Preferences
- Open Clip Description
- Index

you see it in terms of hue and saturation. The size and placement of the colour squares in the 2D
vectorscope show the distribution of all the colours in the clip—like a colour wheel; the distance from
the centre to the perimeter of the scope maps colour saturation, with the outside edge of the scope
delineating pure colour.
3DDisplays the 3D vectorscope. Use the 3D vectorscope to both analyse the colour content of the clip
and to locate specific colours in terms of their chroma and luma values. When you view a clip in the
3D vectorscope, you see it in terms of HLS (hue, lightness, and saturation). Its X, Y, and Z axes represent
red, green, and blue, and the size and placement of the colour cubes show the distribution of all the
colours of the clip in RGB colour space.
The selected vectorscope is displayed in the image window. As you scroll through a clip, the histogram
is updated to display the colour distribution of each frame.
(a) 3D vectorscope (b) 3D histogram
(a) 2D vectorscope (b) Histogram
4 Set the following options to customize the display of the 2D or 3D vectorscope.
To:Enable:
Show the vectorscope canvas. When the canvas is off, the vectorscope is transparent,
but can be outlined.
Canvas
About the Colour Warper | 807