
2010


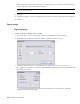


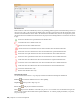
Table Of Contents
- Contents
- Welcome to Autodesk Navisworks Review 2010
- Installation
- Quick Start to Stand-Alone Installation
- Prepare for Installation
- Install and Run Autodesk Navisworks Review 2010
- Move to Autodesk Navisworks from a Previous Release
- Install Autodesk Navisworks for Multiple Users
- Quick Start to Network Administration and Deployment
- Set Up a Deployment
- Installation Troubleshooting
- General Installation Issues
- How can I check my graphics card driver to see if it needs to be updated?
- When performing a Typical installation, what gets installed?
- Why should I specify the Project Folder and Site Folder?
- How do I share the Autodesk Navisworks settings on a site and project basis?
- Where are my product manuals?
- How do I register and activate Autodesk Navisworks?
- Deployment Issues
- Licensing Issues
- Networking Issues
- Uninstall and Maintenance Issues
- When adding or removing features, how can I tell what features get installed by default?
- Is it possible to change the installation folder when adding or removing features?
- When should I reinstall the product instead of a repair?
- Do I need my original disk to reinstall my software?
- When I uninstall my software, what files are left on my system?
- General Installation Issues
- Quick Start to Stand-Alone Installation
- Quick Start
- Get a Whole-Project View
- Work with Files
- Native File Formats
- Compatible CAD Applications
- Use File Readers
- 3DS File Reader
- ASCII Laser Scan File Reader
- Bentley AutoPLANT File Reader
- CIS2 File Reader
- DWG/DXF/SAT File Reader
- DWF File Reader
- DGN File Reader
- Faro Scan File Reader
- IFC File Reader
- IGES File Reader
- Inventor File Reader
- JTOpen File Reader
- Leica Scan File Reader
- MAN File Reader
- PDS File Reader
- Riegl Scan File Reader
- RVM File Reader
- SketchUp SKP File Reader
- STEP File Reader
- STL File Reader
- VRML File Reader
- Z+F Scan File Reader
- Use File Exporters
- Manage Files
- Explore Your Model
- Control Model Appearance and Render Quality
- Review Your Model
- Use Viewpoints and Sectioning Modes
- Record and Play Animations
- Work Within a Team
- Share Data
- Work with Files
- TimeLiner Playback
- Autodesk Navisworks Reference
- File Options Dialog Box
- File Units and Transform Dialog Box
- New Link Dialog Box
- Edit Link Dialog Box
- Edit Viewpoint Dialog Box
- Options Editor
- Default Collision Dialog Box
- Collision Dialog Box
- Convert Object Properties Dialog Box
- Culling Options Dialog Box
- Customize Dialog Box
- Customize Keyboard Dialog Box
- Publish Dialog Box
- Background Settings Dialog Box
- Image Export Dialog Box
- Animation Export Dialog Box
- Glossary
- Index

The Status Icons
Each task has its own Status identified by an icon, representing planned against actual relationships. Each icon
shows two bars. The top bar represents the Planned dates, and the bottom bar represents the Actual dates. If the
Actual Start and Finish dates are the same as the Planned Start and Finish dates, the bars are displayed in green.
Any variations between Planned and Actual dates are displayed in red. Missing Planned or Actual dates are shown
in grey.
Actual Start and End dates equal Planned Start and End dates.
Actual End date before Planned Start date.
Actual Start date after Planned End date.
Actual Start date before Planned Start date and Actual End date after Planned End date.
Actual Start date before Planned Start date and Actual End date equals Planned End date.
Actual Start date equals Planned Start date and Actual End date after Planned End date.
Actual Start date equals Planned Start date and Actual End date before Planned End date.
Actual Start date after Planned Start date and Actual End date equals Planned End date.
Actual Start date before Planned Start date and Actual End date before Planned End date.
Actual Start date after Planned Start date and Actual End date after Planned End date.
Actual Start and End dates only.
Planned Start and End dates only.
The Playback Controls
Use the standard VCR buttons to step and play forwards and backwards through the simulation:
Rewind
will rewind the simulation back to the beginning.
Step Back will step back a single step size.
Reverse Play will play the simulation backwards.
Pause will pause the simulation at the time you press it at. You can then look around and interrogate the
model, or step forwards and backwards through the simulation. To continue playing from where you paused,
just press Play again.
270 | Chapter 13 TimeLiner Playback