
2010

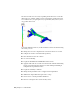
Table Of Contents
- Contents
- Part 1 Stress Analysis
- 1 Get Started With Stress Analysis
- 2 Analyze Models
- 3 View Results
- 4 Revise Models and Stress Analyses
- 5 Generate Reports
- 6 Manage Stress Analysis Files
- Part 2 Dynamic Simulation
- Index

The various results sets are seen by expanding the Result node to reveal the
child nodes. For example, when you run a static analysis, child result nodes
for Von Mises Stress, 1st principal stress, Displacement, Safety Factor, and so
on populate the browser.
To view the different results sets, double-click the browser node. While viewing
the results, you can:
■ Change the color bar to emphasize the stress levels that are of concern.
■ Compare the results to the undeformed geometry.
■ View the mesh used for the solution.
■ Use Contour Shading.
■ Display the Maximum and Minimum Results locations.
■ Apply the same scale across results sets. This becomes relevant when hiding
various parts from from the result view or when dealing with multiple
configurations in parametric studies.
■ Display the boundary conditions.
■ Change the displacement scale to exaggerate the displacement.
■ Animate the displacement through a series of steps.
■ Create a video of the displacement animation.
■ View 2D Convergence Plots (result accuracy curve).
24 | Chapter 3 View Results