
2010

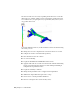
Table Of Contents
- Contents
- Part 1 Stress Analysis
- 1 Get Started With Stress Analysis
- 2 Analyze Models
- 3 View Results
- 4 Revise Models and Stress Analyses
- 5 Generate Reports
- 6 Manage Stress Analysis Files
- Part 2 Dynamic Simulation
- Index
View Results
After you analyze your model under the stress analysis conditions that you defined, you can
visually observe the results of the solution.
This chapter describes how to interpret the visual results of your stress analyses.
Use Results Visualization
When the simulation completes its computations, the graphics region updates
to show:
■ 3D Volume plot and result type.
■ Smooth Shading showing the distribution of stresses.
■ Color bar indicating the stress range.
■ Mesh Information including the number of nodes and elements.
■ Unit information.
■ Result browser node is populated with child nodes for the various results
based on the analysis type.
For Static Analysis, the default result is Von Mises Stress and for Modal Analysis,
the default is Frequency 1. View the results through the use of the display
commands and the Results nodes in the browser. These tools help you visualize
the magnitude of the stresses that occur throughout the component, the
deformation of the component, and the stress safety factor. For modal analysis,
you visualize the natural frequency modes.
Display commands are enabled and located in the Display panel of the Stress
Analysis tab. The default display mode smooths contours.
3
23