
2009
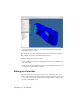

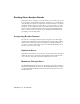


Table Of Contents
- Contents
- Stress Analysis
- 1 Get Started With Stress Analysis
- 2 Analyze Models
- 3 View Results
- 4 Revise Models and Stress Analyses
- 5 Generate Reports
- 6 Manage Stress Analysis Files
- Simulation
- Index
Reading Stress Analysis Results
When the analysis is complete, you see the results of your solution. If you did
a stress analysis or specified that both types of analyses to do, you initially see
the equivalent stress results set displayed. If your initial analysis is a resonant
frequency analysis (without a stress analysis), you see the results set for the
first mode. To view a different results set, double-click that results set in the
browser pane. The currently viewed results set has a check mark displayed
next to it in the browser. You always see the undeformed wireframe of the
part when you are viewing results.
Interpreting Results Contours
The contour colors displayed in the results correspond to the value ranges
shown in the legend. In most cases, results displayed in red are of most interest,
either because of their representation of high stress or high deformation, or
a low factor of safety. Each results set gives you different information about
the effect of the load on your part.
Equivalent Stress
Equivalent stress results use color contours to show you the stresses calculated
during the solution for your model. The deformed model is displayed. The
color contours correspond to the values defined by the color bar.
Maximum Principal Stress
The maximum principal stress gives you the value of stress that is normal to
the plane in which the shear stress is zero. The maximum principal stress helps
you understand the maximum tensile stress induced in the part due to the
loading conditions.
28 | Chapter 3 View Results